Caesarean section rates and peripartum outcomes
- 4 minsI recently saw an interesting Tweet which got me to thinking what the associations were between Caesarean section rates in different countries and maternal and baby outcomes:
Instead of "experts say" can we have "evidence suggests" please? (With links to high quality evidence.) https://t.co/X2K3XQ03ib
— Steven Shorrock (@StevenShorrock) April 13, 2018
So I went away and looked for the OECD data which might help with looking at this question. I found 2 sources from the OECD website, one for the Caesarean section rates and another for the outcomes. I used the 2015 data (the most recent available).
#Load the required packages
library(tidyverse)
library(readr)
library(ggrepel)

#Load the data
Caesarean_rates <- read_csv("../data/DP_LIVE_13042018135921941.csv")
Outcomes <- read_csv("../data/HEALTH_STAT_13042018135958973.csv")

#Join the two sources
Caesarean_rates <- Caesarean_rates %>% filter(TIME == 2015) %>%
  select(LOCATION, TIME, Caesarean_rate = Value)

Outcomes <- Outcomes %>% filter(Year == 2015, VAR != "MATINETW", VAR != "MATIINTW") %>%
  select(COU, VAR, Country, Variable, Year, Outcome_Value = "Value") %>%
#rename the variables into something more understandable
  mutate(VAR = recode(VAR, `MATIINFA` = "Infant mortality",
                      `MATIMATM` = "Maternal mortality",
                      `MATINEON` = "Neonatal mortality",
                      `MATIPERI` = "Perinatal mortality"))

Combined <- left_join(Outcomes, Caesarean_rates, by = c(COU = "LOCATION"))

#Plot the data
ggplot(data = Combined , aes(x = Caesarean_rate, y = Outcome_Value)) +
  geom_point() +
  geom_smooth(method = "lm") +
  geom_text_repel(aes(label = Country)) +
  facet_wrap(~ VAR, nrow = 2) +
  labs(x = "Caesarean sections (per 1,000 live births)",
       y = "Deaths (per 1,000 live births)") +
  theme_light()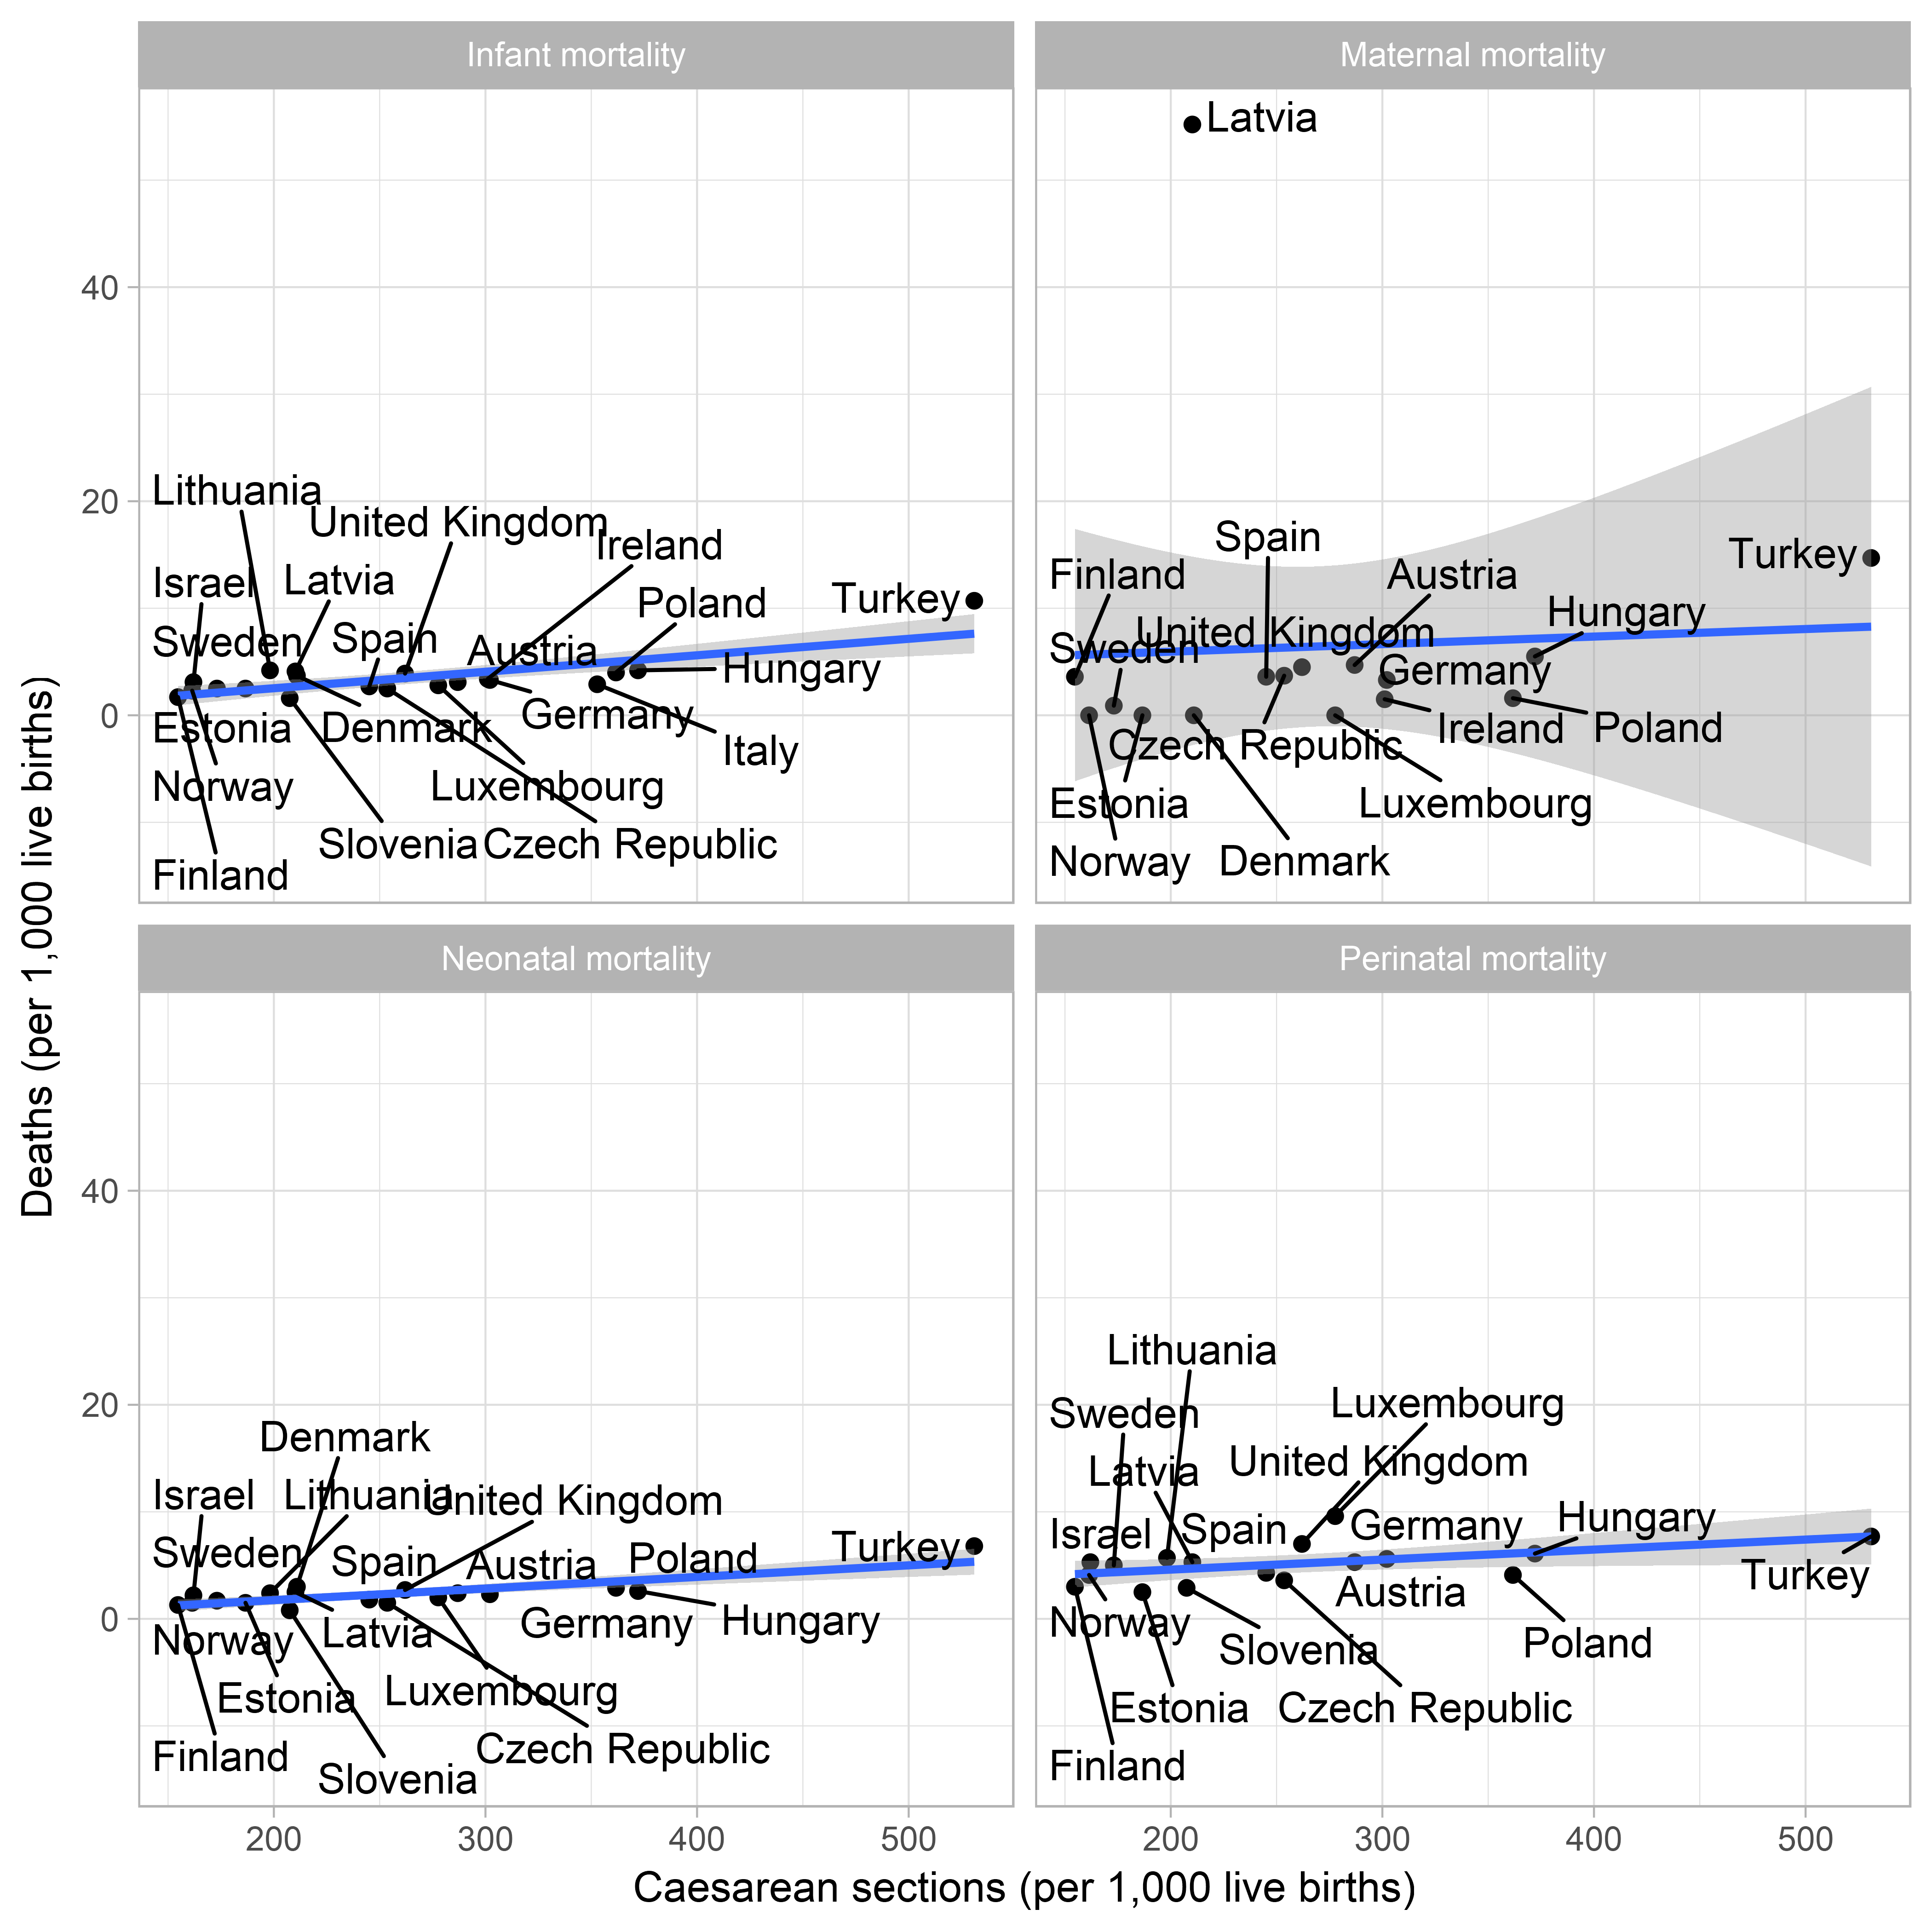
So it seems that all outcomes are worse in countries with higher Caesarean section rates. Of course this is not causal. But it’s an interesting association. Also Latvia seems to have a huge maternal mortality compared to all the other OECD countries, and is not an outlier for baby deaths. I wonder what that’s all about.
sessionInfo()## R version 3.4.2 (2017-09-28)
## Platform: x86_64-w64-mingw32/x64 (64-bit)
## Running under: Windows >= 8 x64 (build 9200)
##
## Matrix products: default
##
## locale:
## [1] LC_COLLATE=English_United Kingdom.1252
## [2] LC_CTYPE=English_United Kingdom.1252
## [3] LC_MONETARY=English_United Kingdom.1252
## [4] LC_NUMERIC=C
## [5] LC_TIME=English_United Kingdom.1252
##
## attached base packages:
## [1] stats graphics grDevices utils datasets methods base
##
## other attached packages:
## [1] knitr_1.17 ggrepel_0.7.0 bindrcpp_0.2 forcats_0.2.0
## [5] stringr_1.2.0 dplyr_0.7.4 purrr_0.2.4 tidyr_0.7.2
## [9] tibble_1.4.2 ggplot2_2.2.1 tidyverse_1.2.1 readr_1.1.1
## [13] sp_1.2-3
##
## loaded via a namespace (and not attached):
## [1] tidyselect_0.2.3 reshape2_1.4.3 haven_1.1.0 lattice_0.20-35
## [5] colorspace_1.2-6 htmltools_0.3.6 yaml_2.1.14 rlang_0.2.0
## [9] pillar_1.2.1 foreign_0.8-66 glue_1.1.1 modelr_0.1.1
## [13] readxl_1.0.0 bindr_0.1 plyr_1.8.4 munsell_0.4.3
## [17] gtable_0.2.0 cellranger_1.1.0 rvest_0.3.2 psych_1.6.9
## [21] evaluate_0.10.1 labeling_0.3 parallel_3.4.2 highr_0.6
## [25] broom_0.4.2 Rcpp_0.12.14 scales_0.5.0 backports_1.0.5
## [29] jsonlite_1.5 mnormt_1.5-5 hms_0.4.2 digest_0.6.14
## [33] stringi_1.1.7 grid_3.4.2 rprojroot_1.2 cli_1.0.0
## [37] tools_3.4.2 magrittr_1.5 lazyeval_0.2.0 crayon_1.3.4
## [41] pkgconfig_2.0.1 rsconnect_0.7 xml2_1.1.1 lubridate_1.7.1
## [45] assertthat_0.2.0 rmarkdown_1.7 httr_1.3.1 rstudioapi_0.7
## [49] R6_2.1.2 nlme_3.1-131 compiler_3.4.2
Danny Wong
Anaesthetist & Health Services Researcher