UK COVID-19 Cases
- 6 minsCOVID-19 is dominating the news, and since a fair number of patients who have tested positive for the virus are being cared for in the hospital I work at, I’ve been following the news intently. As expected, the R community have been at the cutting edge of research in this area and there’s now a coronavirus package released by Rami Krispin that provides tidy data for all the cases worldwide pulled from the Johns Hopkins University Center for Systems Science and Engineering (JHU CCSE) Coronavirus repository.
I thought I’d have a look at the data myself.
#Load the required libraries
library(coronavirus)
library(tidyverse)
library(lubridate)

#Load the data
coronavirus <- coronavirus
head(coronavirus)
## # A tibble: 6 x 7
## Province.State Country.Region Lat Long date cases type
## <chr> <chr> <dbl> <dbl> <date> <int> <chr>
## 1 "" Japan 36 138 2020-01-22 2 confirmed
## 2 "" South Korea 36 128 2020-01-22 1 confirmed
## 3 "" Thailand 15 101 2020-01-22 2 confirmed
## 4 Anhui Mainland China 31.8 117. 2020-01-22 1 confirmed
## 5 Beijing Mainland China 40.2 116. 2020-01-22 14 confirmed
## 6 Chongqing Mainland China 30.1 108. 2020-01-22 6 confirmedI was particularly interested in seeing the rate of increase in the cumulative number of cases confirmed within the UK. There was some debate on Twitter as to whether the confirmed case numbers looked to be following an exponential rise or not.
UM CorVid19 cases double every 2 days. So 100+ today. 200 sat 400 mon 3200 in 8 days. 200,000 in a couple of weeks. 5-10% need ICU = 10-20k: 2-4x number of UK ICU beds, which are already full. Do your bit. Wash hands. Self isolate.
— Hugh Montgomery (@hugh_montgomery) March 6, 2020
Let’s see what it looks like when the UK numbers are plotted out over time.
coronavirus %>% filter(Country.Region == "UK") %>%
  filter(type == "confirmed") %>%
  mutate(cumul_freq = cumsum(cases)) %>%
  mutate(date = ymd(date)) %>%
  ggplot(aes(x = date, y = cumul_freq)) +
  geom_line() +
  labs(x = "Date",
       y = "Cases",
       title = "Cumulative frequency of confirmed cases",
       subtitle = "Data from the 2019 Novel Coronavirus Visual Dashboard\nJohns Hopkins University Center for Systems Science and Engineering (JHU CSSE)") +
  scale_x_date(labels = scales::date_format("%d-%m-%Y")) +
  theme_classic()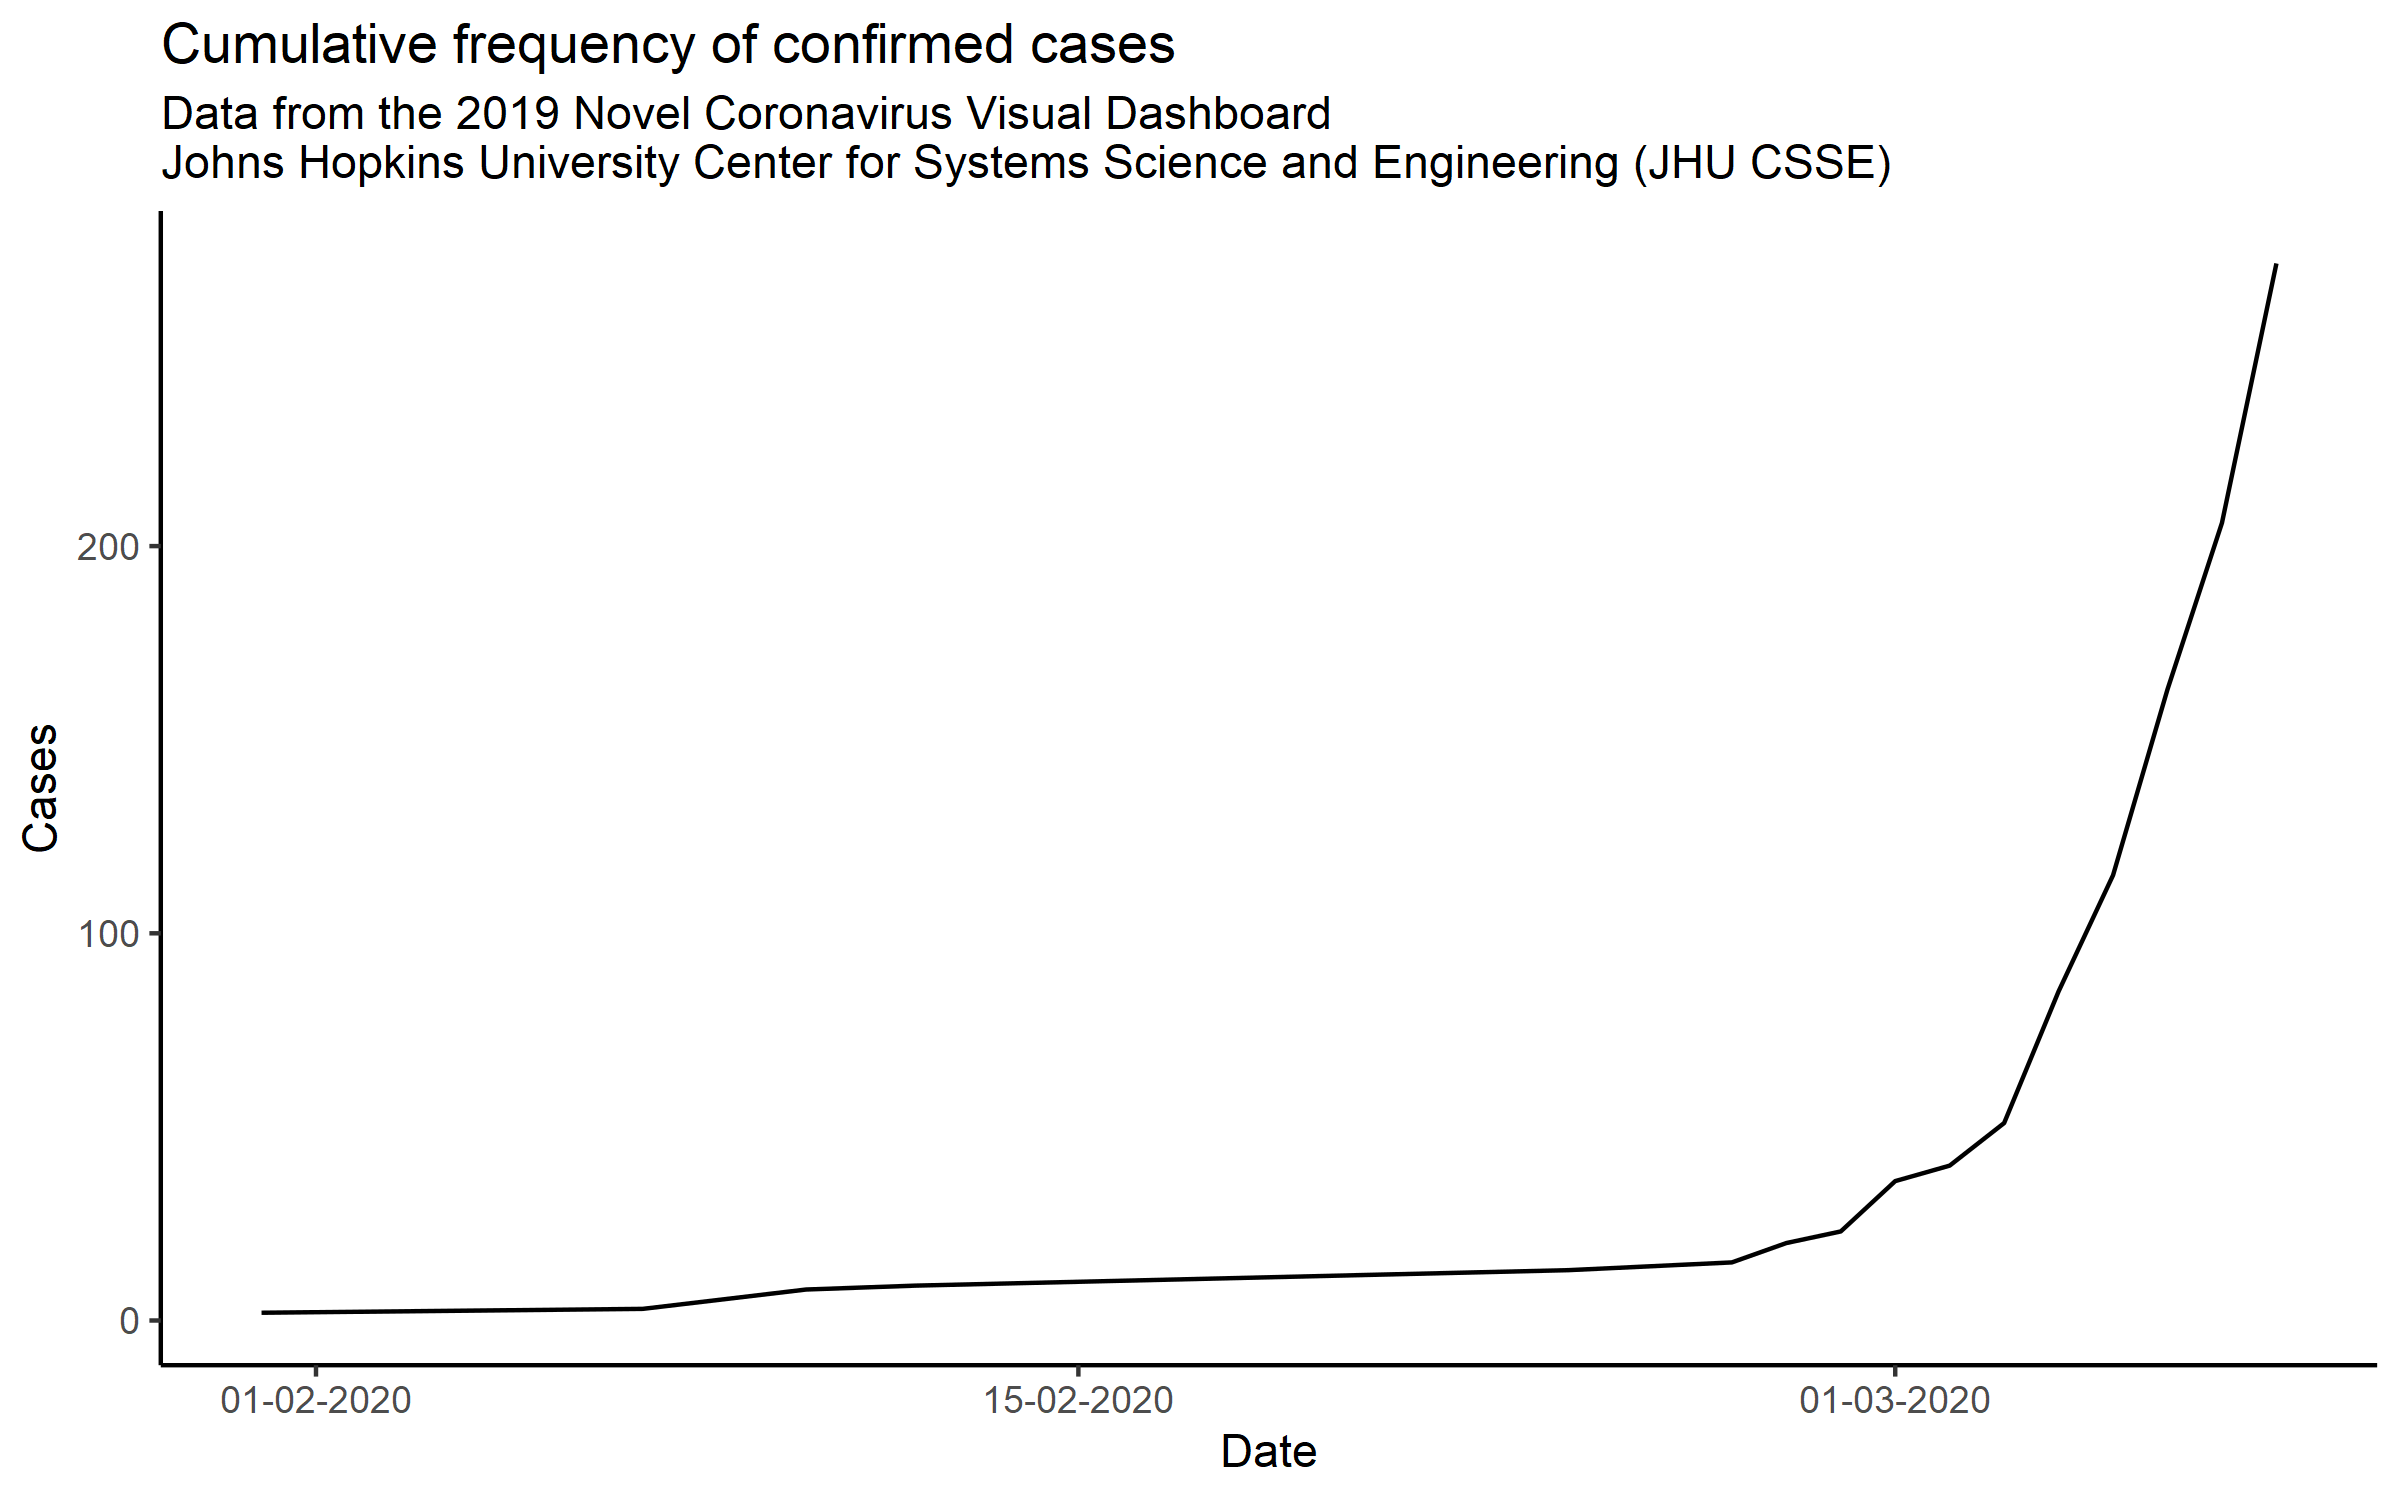
#ggsave("updated_plot1.png", dpi = 300, height = 5, width = 8)Certainly looks like it’s rising at what looks like an exponential rate at this early stage. The data from this source is updated daily, but there is a lag and the last entry was dated 6 March 2020, the news today (7 March 2020) seems to suggest we have actually exceeded 200 cases.
I’m slightly worried…
Edited 09 March 2020
I decided to refresh the numbers a bit with more recent data and also look at the curves for some of the other European countries with similar GDPs to the UK.
coronavirus %>%
    group_by(Country.Region, Province.State, type) %>%
    mutate(cumul_freq = cumsum(cases)) %>%
    mutate(date = ymd(date)) %>%
  filter(Country.Region %in% c("Germany", "UK", "France", "Italy", "Spain", "Netherlands")) %>%
  filter(date > ymd("2020-02-01")) %>%
  rename(Country = Country.Region) %>%
  filter(type == "confirmed") %>%
  ggplot(aes(x = date, y = cumul_freq, col = Country)) +
  geom_line() +
  labs(x = "Date",
       y = "Cases",
       title = "Cumulative frequency of confirmed cases by country",
       subtitle = "Data from the 2019 Novel Coronavirus Visual Dashboard\nJohns Hopkins University Center for Systems Science and Engineering (JHU CSSE)") +
  scale_x_date(labels = scales::date_format("%d-%m-%Y")) +
  theme_classic() +
  theme(legend.position="bottom")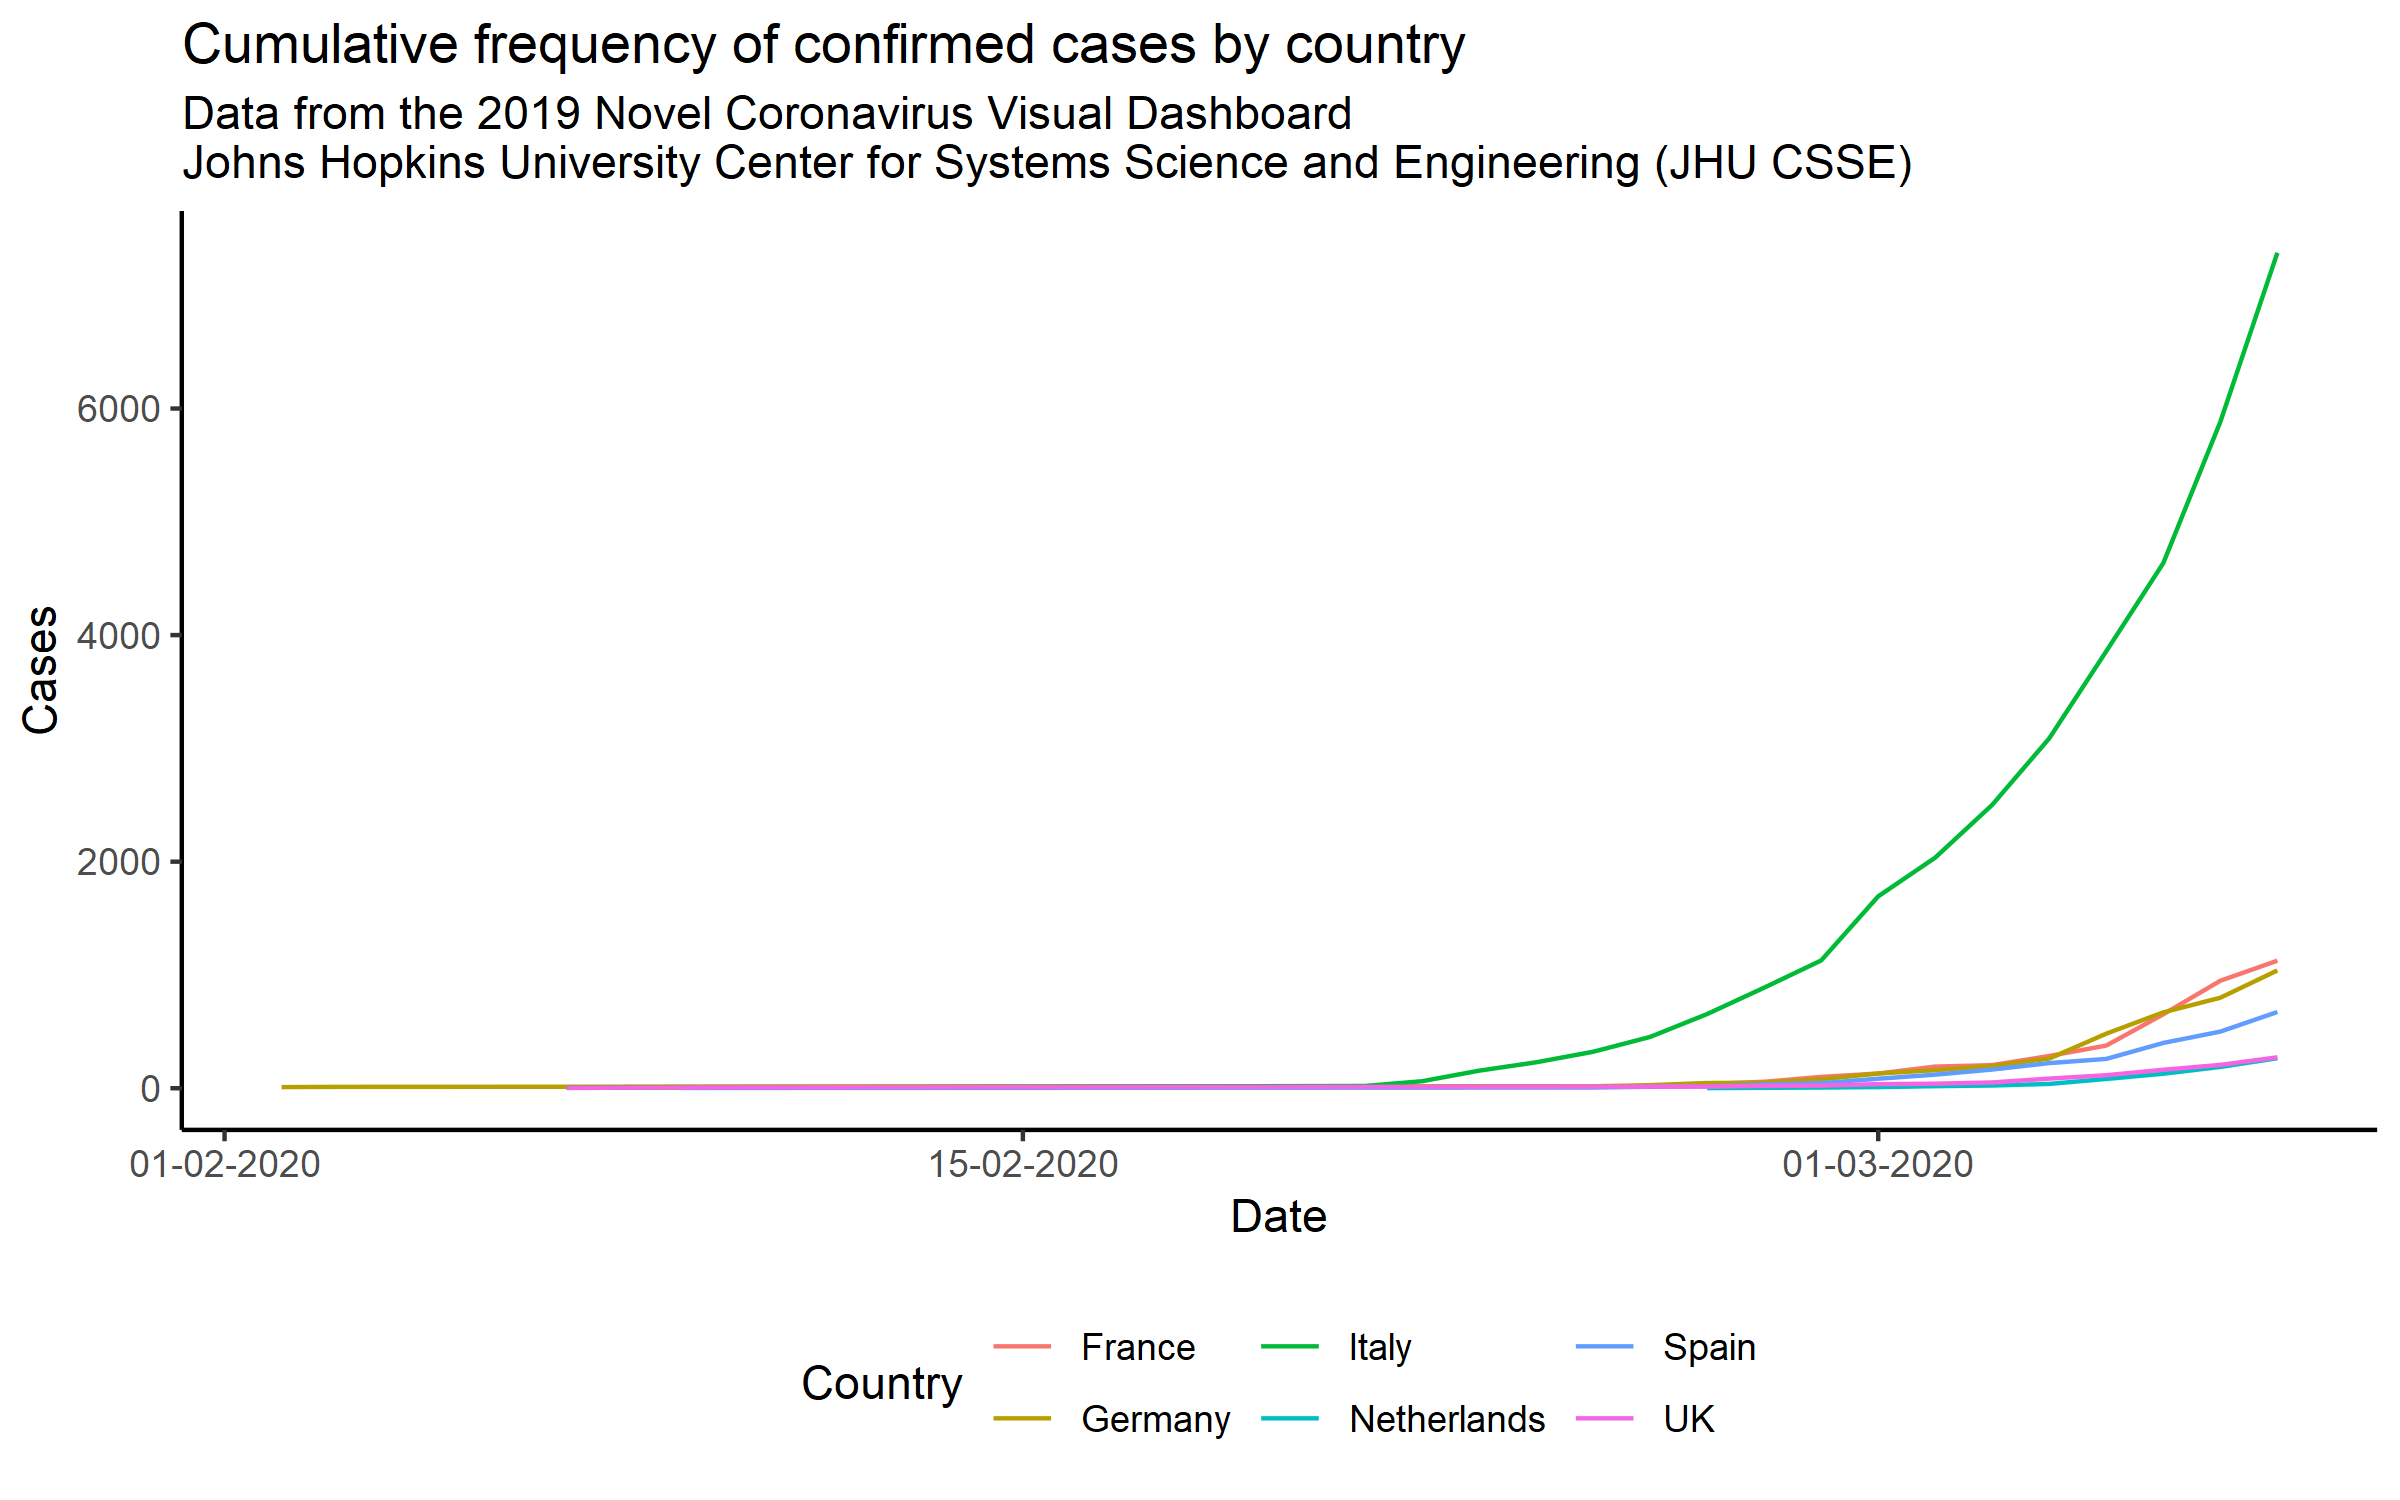
#ggsave("updated_plot2.png", dpi = 300, height = 5, width = 8)It looks like the case numbers are all following an exponential function…
sessionInfo()## R version 3.5.2 (2018-12-20)
## Platform: x86_64-w64-mingw32/x64 (64-bit)
## Running under: Windows 10 x64 (build 18363)
##
## Matrix products: default
##
## locale:
## [1] LC_COLLATE=English_United Kingdom.1252
## [2] LC_CTYPE=English_United Kingdom.1252
## [3] LC_MONETARY=English_United Kingdom.1252
## [4] LC_NUMERIC=C
## [5] LC_TIME=English_United Kingdom.1252
##
## attached base packages:
## [1] stats graphics grDevices utils datasets methods base
##
## other attached packages:
## [1] knitr_1.25 lubridate_1.7.4 forcats_0.3.0
## [4] stringr_1.3.1 dplyr_0.8.0.1 purrr_0.2.5
## [7] readr_1.1.1 tidyr_0.8.1 tibble_2.1.1
## [10] ggplot2_3.0.0 tidyverse_1.2.1 coronavirus_0.1.0.9000
##
## loaded via a namespace (and not attached):
## [1] progress_1.2.0 tidyselect_0.2.5 xfun_0.10
## [4] haven_1.1.2 lattice_0.20-38 colorspace_1.3-2
## [7] gganimate_1.0.5 utf8_1.1.4 rlang_0.3.4
## [10] pillar_1.3.1 glue_1.3.0 withr_2.1.2
## [13] tweenr_1.0.1 modelr_0.1.2 readxl_1.1.0
## [16] plyr_1.8.4 munsell_0.5.0 gtable_0.2.0
## [19] cellranger_1.1.0 rvest_0.3.2 evaluate_0.14
## [22] labeling_0.3 fansi_0.4.0 highr_0.7
## [25] broom_0.5.0 Rcpp_1.0.1 backports_1.1.2
## [28] scales_1.0.0 magick_2.2 jsonlite_1.5
## [31] farver_1.0 hms_0.4.2 packrat_0.4.9-3
## [34] digest_0.6.16 stringi_1.1.7 grid_3.5.2
## [37] cli_1.1.0 tools_3.5.2 magrittr_1.5
## [40] lazyeval_0.2.1 crayon_1.3.4 pkgconfig_2.0.2
## [43] xml2_1.2.0 prettyunits_1.0.2 assertthat_0.2.0
## [46] httr_1.3.1 rstudioapi_0.7 R6_2.2.2
## [49] nlme_3.1-137 compiler_3.5.2
Danny Wong
Anaesthetist & Health Services Researcher