DiagrammeR for vector diagrams
- 2 minsI’ve previously shown how we can use the DiagrammeR package to draw STROBE/CONSORT diagrams in R. But the package has far more capabilities than that! I’m using it to draw some figures in my MPhil to PhD Upgrade Report and will eventually use it in my thesis.
Here is an example of how useful it can be:
library(DiagrammeR)    #To draw the diagram
library(DiagrammeRsvg) #To convert it to an SVG
library(rsvg)          #To convert the SVG into a PNG

Pathway_diagram_enhanced <- grViz("
digraph dot {

      graph [layout = dot]

      node [shape = rectangle,
      style = filled,
      color = white,
      width = 3,
      fontsize = 14,
      fontname = 'Arial']

      node [fillcolor = grey]
      Home [label = 'Home']

      node [fillcolor = skyblue]
      Surgical [label = 'Surgical Management']
      PreOp [label = 'Preoperative planning\n- Address modifiable risks\n- Further investigations']
      IntraOp [label = 'Intraoperative management\n(Undergoes surgery)']
      PostOp [label = 'Postoperative recovery']

      node [fillcolor = pink]
      ICU [label = 'Critical Care']

      Ward [label = 'Surgical Ward']

      node [fillcolor = orange]
      Enhanced [label = 'Enhanced Care Area\n(Level 1+ unit)']

      edge [color = grey, constraint = true]
      Surgical -> PreOp
      PreOp -> IntraOp
      IntraOp -> PostOp

      PostOp -> {ICU Enhanced Ward}

      edge [color = grey, constraint = false]
      ICU -> {Enhanced Ward}
      Ward -> {Enhanced ICU}

      edge [color = grey, constraint = true]
      Enhanced -> {ICU Ward}

      edge [xlabel = 'Discharge',
      fontsize = 14,
      fontname = 'Arial']
      Ward -> Home

      }")

Pathway_diagram_enhanced %>% export_svg() %>% charToRaw() %>%   rsvg_png("../figures/2018-06-12-DiagrammeR-for-vector-diagrams/Pathway_enhanced.png", height = 850)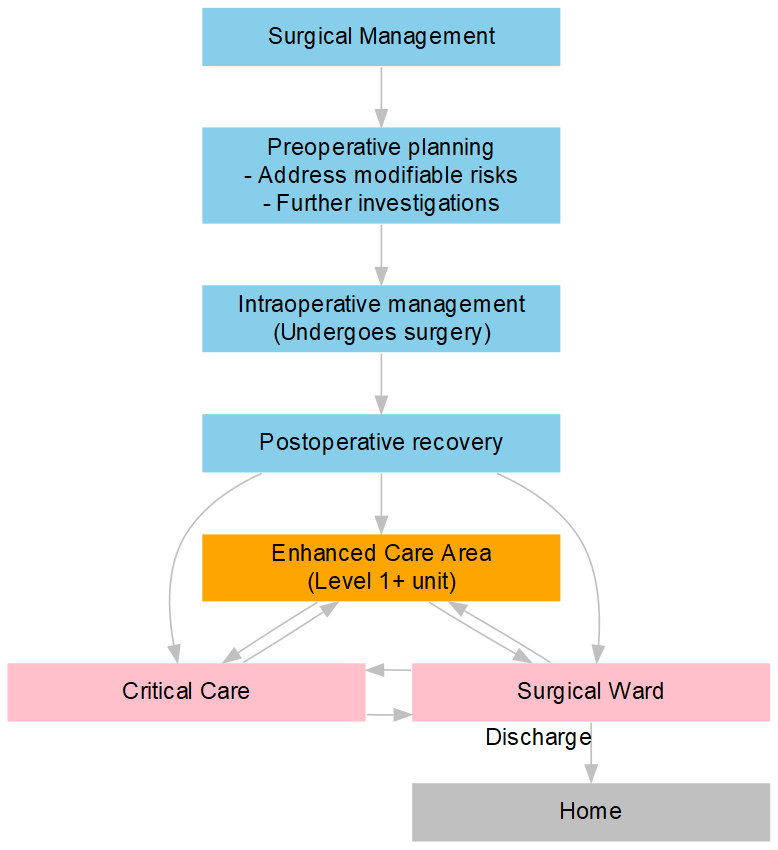
sessionInfo()## R version 3.4.2 (2017-09-28)
## Platform: x86_64-w64-mingw32/x64 (64-bit)
## Running under: Windows >= 8 x64 (build 9200)
##
## Matrix products: default
##
## locale:
## [1] LC_COLLATE=English_United Kingdom.1252
## [2] LC_CTYPE=English_United Kingdom.1252
## [3] LC_MONETARY=English_United Kingdom.1252
## [4] LC_NUMERIC=C
## [5] LC_TIME=English_United Kingdom.1252
##
## attached base packages:
## [1] stats graphics grDevices utils datasets methods base
##
## other attached packages:
## [1] rsvg_1.1 DiagrammeRsvg_0.1 DiagrammeR_0.9.2 knitr_1.17
##
## loaded via a namespace (and not attached):
## [1] Rcpp_0.12.14 pillar_1.2.1 compiler_3.4.2
## [4] RColorBrewer_1.1-2 influenceR_0.1.0 plyr_1.8.4
## [7] bindr_0.1 viridis_0.4.1 tools_3.4.2
## [10] digest_0.6.14 jsonlite_1.5 viridisLite_0.2.0
## [13] evaluate_0.10.1 anomalize_0.1.0 tibble_1.4.2
## [16] gtable_0.2.0 rgexf_0.15.3 pkgconfig_2.0.1
## [19] rlang_0.2.0 igraph_1.1.2 rstudioapi_0.7
## [22] curl_1.2 yaml_2.1.18 bindrcpp_0.2
## [25] gridExtra_2.3 downloader_0.4 dplyr_0.7.4
## [28] stringr_1.2.0 htmlwidgets_1.0 hms_0.4.2
## [31] grid_3.4.2 glue_1.1.1 R6_2.1.2
## [34] Rook_1.1-1 XML_3.98-1.4 tidyr_0.7.2
## [37] ggplot2_2.2.1 purrr_0.2.4 readr_1.1.1
## [40] magrittr_1.5 scales_0.5.0 htmltools_0.3.6
## [43] assertthat_0.2.0 colorspace_1.2-6 brew_1.0-6
## [46] V8_1.5 stringi_1.1.7 visNetwork_2.0.3
## [49] lazyeval_0.2.0 munsell_0.4.3
Danny Wong
Anaesthetist & Health Services Researcher