Mapping UK Traffic Accidents
- 2 minsI saw a post on Lucas Puente’s blog today which mapped US traffic fatalities in 2015 using an open dataset released by the US National Highway Traffic Safety Administration and was inspired to do similar using UK data.
Fortunately the UK has been releasing public data of this information for some time and data from 1979 onwards is available! I decided to use 2015 data to try and apply Lucas’ method. This data shows “personal injury accidents on public roads that are reported to the police, and subsequently recorded, using the STATS19 accident reporting form” according to the metadata.
library(ggplot2)

accidents <- read.csv("../data/DfTRoadSafety_Accidents_2015.csv")

#Load the map data for the UK
UK_map_data <- map_data("world", c('UK', 'Isle of Man','Isle of Wight', 'Wales:Anglesey'))

#Start plotting
map <- ggplot() +
  geom_polygon(data=UK_map_data, aes(x=long,y=lat,group=group), colour = alpha("black", 1/4), fill = NA) +
  #Add points (one per incident):
  geom_point(data=accidents, aes(x=Longitude, y=Latitude), alpha=0.05, size=0.2, col="red") +
  #Add a title:
  ggtitle("Traffic Accidents in 2015") +
  #Adjust the map projection
  coord_map("albers", lat0=49.84, lat1=60.85) +
  #Adjust the theme:
  theme_classic() +
  theme(panel.border = element_blank(),
        axis.text = element_blank(),
        line = element_blank(),
        axis.title = element_blank(),
        plot.title = element_text(size=40, face="bold"))

map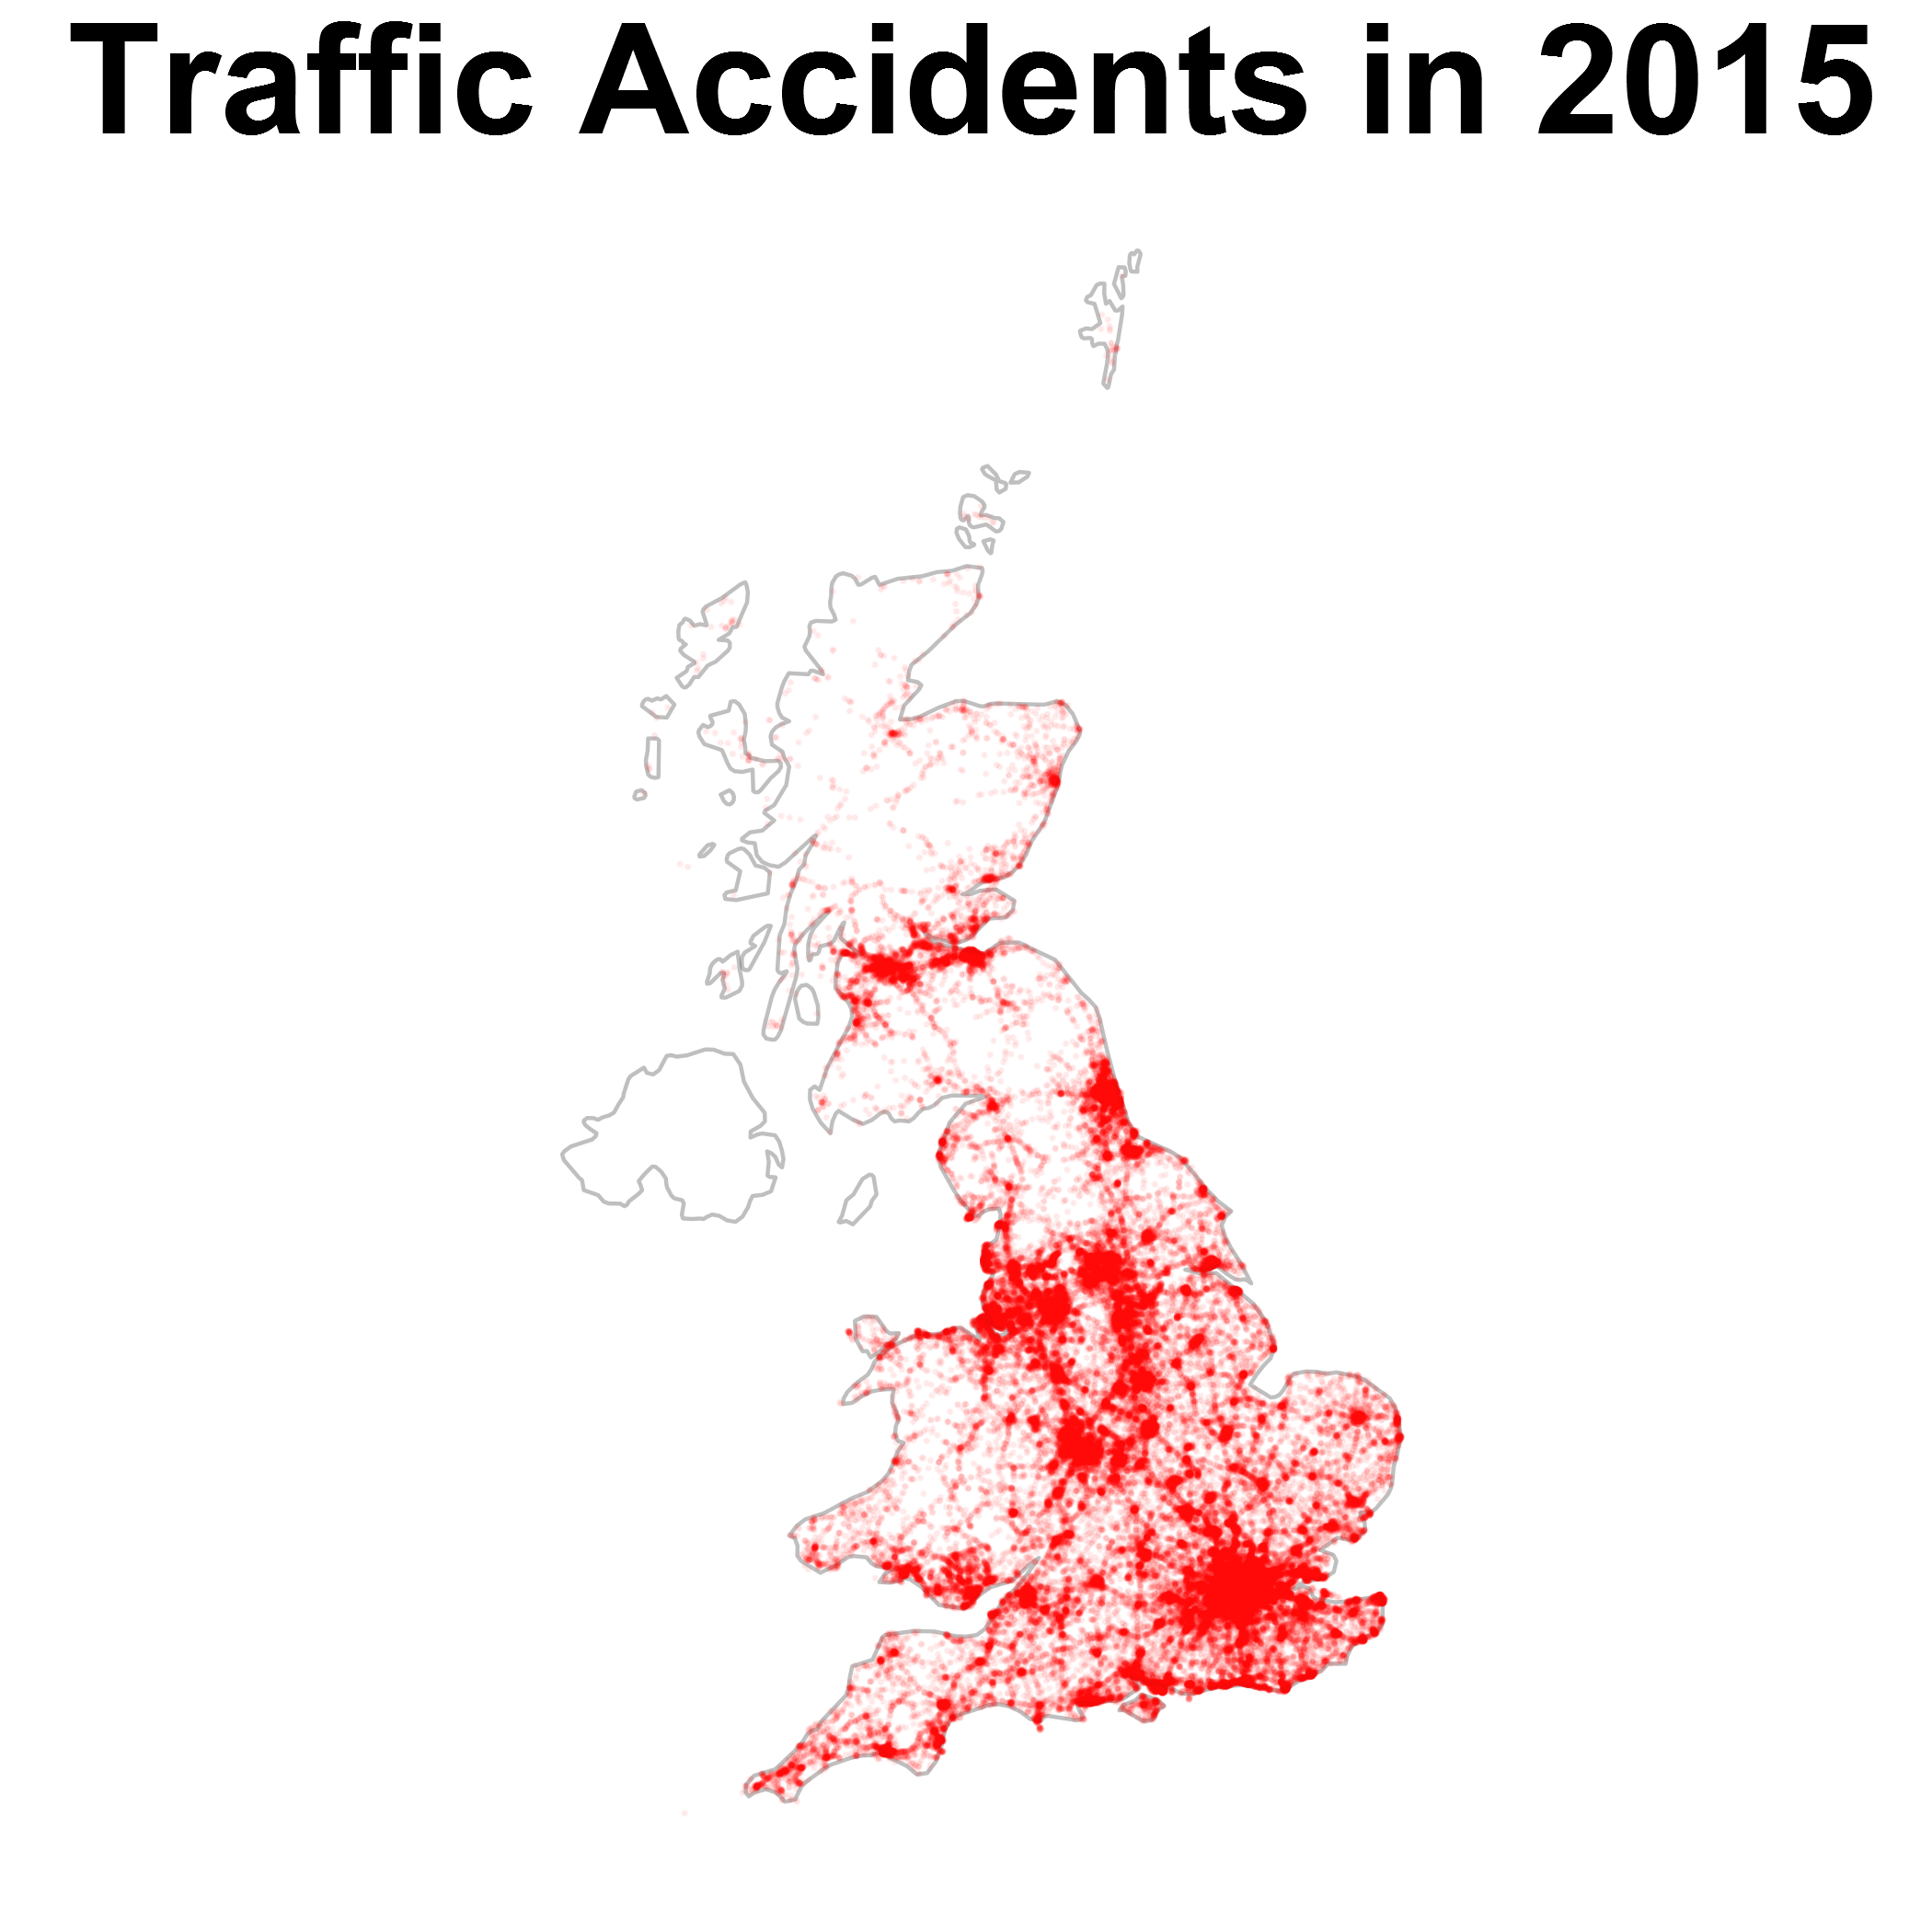
Thanks to Lucas for sharing his method!
sessionInfo()## R version 3.3.1 (2016-06-21)
## Platform: x86_64-w64-mingw32/x64 (64-bit)
## Running under: Windows >= 8 x64 (build 9200)
##
## locale:
## [1] LC_COLLATE=English_United Kingdom.1252
## [2] LC_CTYPE=English_United Kingdom.1252
## [3] LC_MONETARY=English_United Kingdom.1252
## [4] LC_NUMERIC=C
## [5] LC_TIME=English_United Kingdom.1252
##
## attached base packages:
## [1] stats graphics grDevices utils datasets methods base
##
## other attached packages:
## [1] maps_3.1.1 ggplot2_2.1.0 knitr_1.14
##
## loaded via a namespace (and not attached):
## [1] Rcpp_0.12.6 grid_3.3.1 plyr_1.8.4 gtable_0.2.0
## [5] formatR_1.4 magrittr_1.5 evaluate_0.9 scales_0.4.0
## [9] stringi_1.1.1 mapproj_1.2-4 labeling_0.3 tools_3.3.1
## [13] stringr_1.0.0 munsell_0.4.3 colorspace_1.2-6
Danny Wong
Anaesthetist & Health Services Researcher