Webscraping NBA data: 2015-16 Golden State Warriors vs 1995-96 Chicago Bulls
- 5 minsThe 2015-16 Golden State Warriors are on the verge of either equalling or beating the 1995-96 Chicago Bulls’ record of 72 wins in the NBA regular season. Let’s use r to scrape some data from NBA.com to graph the Warriors’ progress over the season in comparison to the Bull’s record-setting season.
We will use the rvest package to do so.
library(rvest)
library(tidyr)

nba <- html("http://www.nba.com/news/2015-16-golden-state-warriors-chase-1995-96-chicago-bulls-all-time-wins-record/")
data <- nba %>% html_nodes("table") %>% html_table(header = TRUE, fill = TRUE)

summary(data)
## Length Class Mode
## [1,] 416 data.frame list
## [2,] 5 data.frame listdata <- data[[2]]
head(data)## Warriors result Record Game Number Bulls result Record
## 1 111-95 W vs. Pelicans 1-0 1 105-91 W vs. Hornets 1-0
## 2 112-92 W vs. Rockets 2-0 2 107-85 W vs. Celtics 2-0
## 3 134-120 W @ Pelicans 3-0 3 117-108 W vs. Raptors 3-0
## 4 119-69 W vs. Grizzlies 4-0 4 106-88 W @ Cavs 4-0
## 5 112-108 W vs. Clippers 5-0 5 110-106 W vs. Blazers 5-0
## 6 119-104 W vs. Nuggets 6-0 6 94-88 L @ Magic 5-1#split the dataframes into seperate Warriors and Bulls dataframes
colnames(data)[3] <- "Game" #To remove the space between Game Number
warriors <- cbind(data[3], data[2])
bulls <- cbind(data[3], data[5])
#Separate the wins and losses into 2 columns
warriors <- warriors %>% separate(col = Record, into = c("W", "L"), sep = "-")
bulls <- bulls %>% separate(col = Record, into = c("W", "L"), sep = "-")
#Plot with base graphics
plot(W ~ Game, type="l", col="red", data = bulls, lty = 2) #Dotted red line for Bulls
points(W ~ Game, type="l", col="blue", data = warriors) #Solid blue line for Warriors 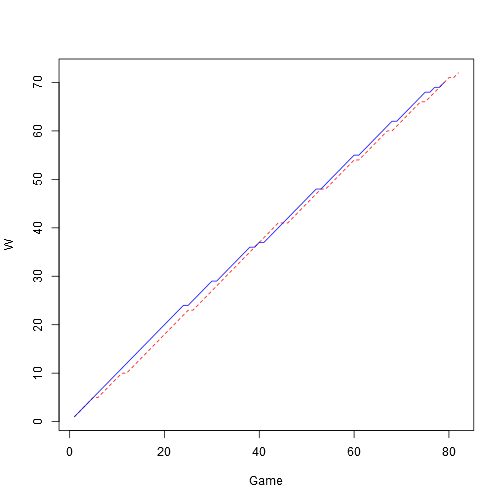
Do we think that the Warriors can get to 73 wins this season? Let’s try and predict this with a linear regression model, now for a bit of fun! Of course this is fraught with methodological problems, so don’t gamble any money based on the result.
#Fit a linear model
#Add a regression line
model <- lm(W ~ Game, data = warriors)
summary(model)
##
## Call:
## lm(formula = W ~ Game, data = warriors)
##
## Residuals:
## Min 1Q Median 3Q Max
## -1.4560 -0.3734 0.0666 0.4203 1.2465
##
## Coefficients:
## Estimate Std. Error t value Pr(>|t|)
## (Intercept) 1.573515 0.140730 11.18 <2e-16 ***
## Game 0.882498 0.003056 288.73 <2e-16 ***
## ---
## Signif. codes: 0 '***' 0.001 '**' 0.01 '*' 0.05 '.' 0.1 ' ' 1
##
## Residual standard error: 0.6195 on 77 degrees of freedom
## (3 observations deleted due to missingness)
## Multiple R-squared: 0.9991, Adjusted R-squared: 0.9991
## F-statistic: 8.337e+04 on 1 and 77 DF, p-value: < 2.2e-16plot(W ~ Game, type="l", col="red", data = bulls, lty = 2)
points(W ~ Game, type="l", col="blue", data = warriors)
#Add a dotted black line for the regression line
abline(model, lty = 2)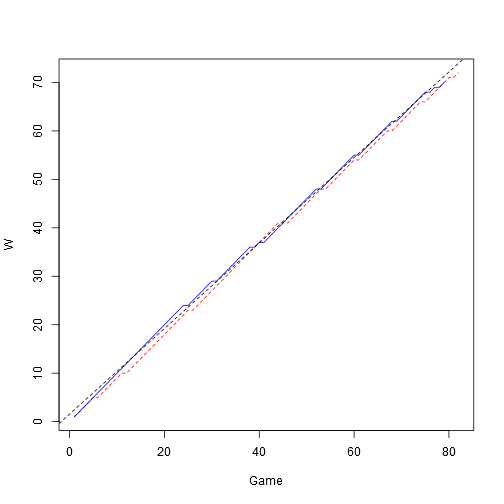
#Predict number of wins
#Add a regression line
predict(model, newdata = data.frame(Game = 82), interval = "prediction")
## fit lwr upr
## 1 73.93832 72.67093 75.2057Ok the model says that the Warriors will have 74 wins this season. BUT, they now have 70 wins and only 3 games left, making it an impossibility to reach 74 wins. So predicting based purely on this model can’t be right.

Danny Wong
Anaesthetist & Health Services Researcher