Driving Home for Christmas
- 4 minsIs it safer to drive around Christmas time? On one hand the weather conditions might be more hazardous: winter increases the likelihood of rain, snow and ice on the roads, people might be making more long-distance trips to go to their friends’ or families’ homes to visit. On the other hand the number of people commuting for work decreases and the roads may conversely be less busy.
Fortunately data.gov.uk maintains data on road accidents, which I have previously mapped here. We can use this same data to see if there are any seasonal patterns in terms of the road accidents which happen.
For this, let’s analyse the data from 2011 to 2015.
#Load the required packages
library(dplyr)
library(lubridate)

#Load the data
for (i in 2011:2015) {
  temp <- read.csv(paste0("../data/DfTRoadSafety_Accidents_", i, ".csv"))
  assign(paste0("accidents", i), temp)
}
rm(temp)

colnames(accidents2014)[1] <- "Accident_Index"
colnames(accidents2015)[1] <- "Accident_Index"

accidents <- rbind(accidents2011, accidents2012) %>%
  rbind(accidents2013) %>%
  rbind(accidents2014) %>%
  rbind(accidents2015)

rm("accidents2011", "accidents2012", "accidents2013" , "accidents2014", "accidents2015")

accidents <- accidents %>% mutate(Date = dmy(Date)) %>%
  arrange(Date)

#Coerce the data into a time-series
accidents_ts <- table(accidents$Date) %>%
  as.data.frame() %>%
  mutate(date = ymd(Var1)) %>%
  select(Freq) %>%
  ts(start = c(2011, 1, 1), freq = 365)

accidents_fatal_ts <- table(filter(accidents, Accident_Severity == 1)$Date) %>%
  as.data.frame() %>%
  mutate(date = ymd(Var1)) %>%
  select(Freq) %>%
  ts(start = c(2011, 1, 1), freq = 365)

plot(accidents_ts)
We can see that there’s a faint seasonal component to the accidents: the number of accidents dips around Christmas and New Year. To see this more clearly, we can perform a Seasonal Decomposition of Time Series by LOESS, using the stl function, to obtain the trend, seasonal and irregular (noise) components of the time series.
accidents_ts_decomposed <- accidents_ts[,1] %>% stl(s.window = "periodic", t.window = 101)
plot(accidents_ts_decomposed)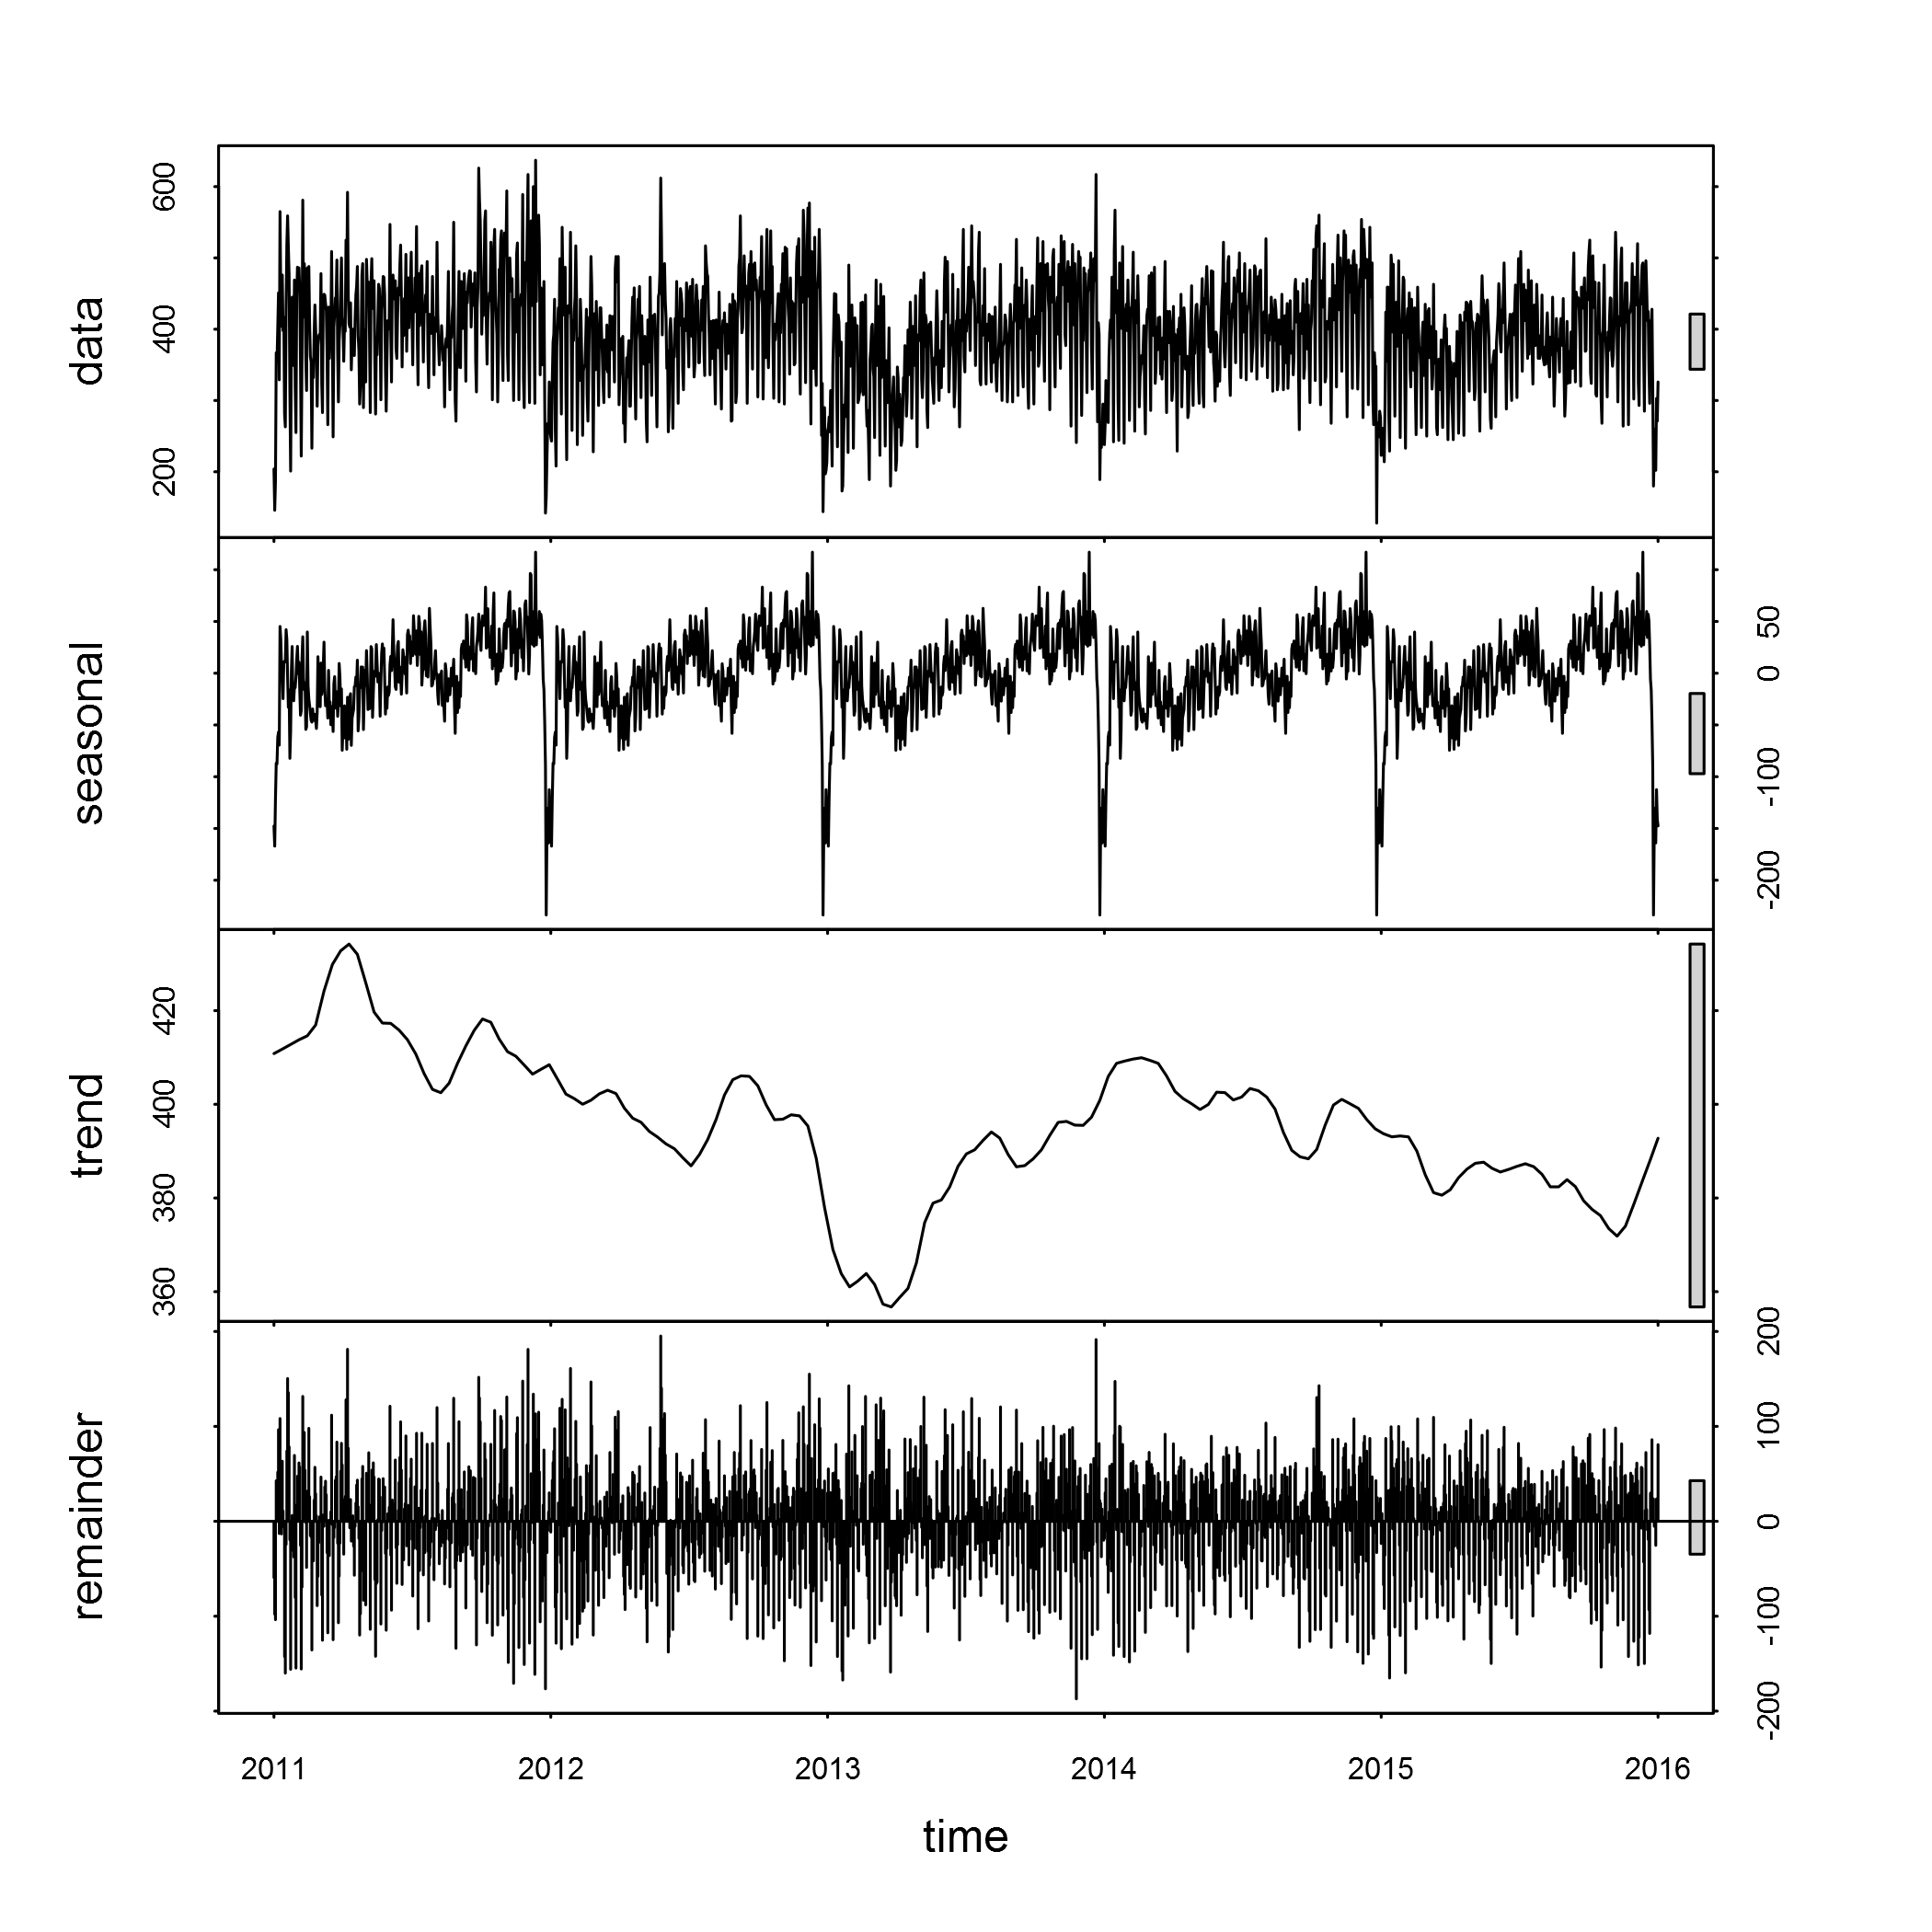
sessionInfo()## R version 3.3.1 (2016-06-21)
## Platform: x86_64-w64-mingw32/x64 (64-bit)
## Running under: Windows >= 8 x64 (build 9200)
##
## locale:
## [1] LC_COLLATE=English_United Kingdom.1252
## [2] LC_CTYPE=English_United Kingdom.1252
## [3] LC_MONETARY=English_United Kingdom.1252
## [4] LC_NUMERIC=C
## [5] LC_TIME=English_United Kingdom.1252
##
## attached base packages:
## [1] stats graphics grDevices utils datasets methods base
##
## other attached packages:
## [1] lubridate_1.5.6 dplyr_0.5.0 knitr_1.14
##
## loaded via a namespace (and not attached):
## [1] lazyeval_0.2.0 R6_2.1.2 assertthat_0.1 magrittr_1.5
## [5] formatR_1.4 DBI_0.5 tools_3.3.1 tibble_1.2
## [9] Rcpp_0.12.7 stringi_1.1.1 stringr_1.0.0 evaluate_0.9
Danny Wong
Anaesthetist & Health Services Researcher