Looking at Specialty Training Competition Ratios (2)
- 11 minsSince my last post, some new data from Round 1 of the 2016 Specialty Training Applications surfaced on Twitter. This offered up the opportunity to update my graphs to include the most current data.
Unfortunately, the data was presented in a picture format, so I had to hand-transcribe onto a spreadsheet, and appended it to the bottom of the data I scraped from my previous post. If you want to see the spreadsheet, I have uploaded it here.
But let’s fire up R.
#Load the required packages
require(dplyr) #To wrangle data
require(ggplot2) #To plot graphs
require(knitr)

#The data
CompetitionRatios <- read.csv("https://raw.githubusercontent.com/dannyjnwong/dannyjnwong.github.io/master/data/CompetitionRatios2013-2016.csv")

#Let's ensure the ratios are accurate
CompetitionRatios <- mutate(CompetitionRatios, Ratio = Applicants/Posts)
CompetitionRatios$Year <- as.factor(CompetitionRatios$Year)
CompetitionRatios$Applicants <- as.numeric(CompetitionRatios$Applicants)
CompetitionRatios$Posts <- as.numeric(CompetitionRatios$Posts)

#Let's see the table
kable(CompetitionRatios)| Specialty | Applicants | Posts | Ratio | Year |
|---|---|---|---|---|
| ACCS EM | 534 | 203 | 2.630542 | 2013 |
| Anaesthetics | 1189 | 478 | 2.487448 | 2013 |
| Broad-Based Training | 429 | 52 | 8.250000 | 2013 |
| Cardiothoracic Surgery (Pilot) | 68 | 6 | 11.333333 | 2013 |
| Clinical Radiology | 751 | 185 | 4.059459 | 2013 |
| Core Medical Training | 3088 | 1209 | 2.554177 | 2013 |
| Core Psychiatry Training | 650 | 437 | 1.487414 | 2013 |
| Core Surgical Training | 1296 | 676 | 1.917160 | 2013 |
| General Practice | 6447 | 2787 | 2.313240 | 2013 |
| Histopathology | 154 | 120 | 1.283333 | 2013 |
| Medical Microbiology & Virology | 108 | 21 | 5.142857 | 2013 |
| Neurosurgery | 183 | 37 | 4.945946 | 2013 |
| Obstetrics and Gynaecology | 591 | 204 | 2.897059 | 2013 |
| Ophthalmology | 323 | 71 | 4.549296 | 2013 |
| Paediatrics | 793 | 360 | 2.202778 | 2013 |
| Public Health | 602 | 70 | 8.600000 | 2013 |
| ACCS EM | 759 | 363 | 2.090909 | 2014 |
| Anaesthetics | 1262 | 595 | 2.121008 | 2014 |
| Broad-Based Training | 258 | 42 | 6.142857 | 2014 |
| Cardiothoracic Surgery (Pilot) | 72 | 7 | 10.285714 | 2014 |
| Clinical Radiology | 798 | 227 | 3.515419 | 2014 |
| Community Sexual and Reproductive Health | 33 | 7 | 4.714286 | 2014 |
| Core Medical Training | 3065 | 1468 | 2.087875 | 2014 |
| Core Psychiatry Training | 643 | 497 | 1.293763 | 2014 |
| Core Surgical Training | 1370 | 625 | 2.192000 | 2014 |
| General Practice | 5477 | 3391 | 1.615158 | 2014 |
| Histopathology | 165 | 93 | 1.774193 | 2014 |
| Medical Microbiology | 50 | 14 | 3.571429 | 2014 |
| Neurosurgery | 159 | 24 | 6.625000 | 2014 |
| Obstetrics and Gynaecology | 583 | 240 | 2.429167 | 2014 |
| Ophthalmology | 353 | 82 | 4.304878 | 2014 |
| Oral and Maxillo Facial Surgery (Pilot) | 33 | 4 | 8.250000 | 2014 |
| Paediatrics | 814 | 435 | 1.871264 | 2014 |
| Public Health | 686 | 78 | 8.794872 | 2014 |
| ACCS EM | 881 | 363 | 2.426997 | 2015 |
| Anaesthetics | 1294 | 629 | 2.057234 | 2015 |
| Broad-Based Training | 363 | 83 | 4.373494 | 2015 |
| Cardiothoracic Surgery | 68 | 8 | 8.500000 | 2015 |
| Clinical Radiology | 917 | 247 | 3.712551 | 2015 |
| Community Sexual and Reproductive Health | 100 | 2 | 50.000000 | 2015 |
| Core Medical Training | 2632 | 1550 | 1.698065 | 2015 |
| Core Psychiatry Training | 662 | 466 | 1.420601 | 2015 |
| Core Surgical Training | 1396 | 604 | 2.311258 | 2015 |
| General Practice | 5112 | 3612 | 1.415282 | 2015 |
| Histopathology | 189 | 79 | 2.392405 | 2015 |
| Neurosurgery | 169 | 30 | 5.633333 | 2015 |
| Obstetrics and Gynaecology | 599 | 238 | 2.516807 | 2015 |
| Ophthalmology | 374 | 95 | 3.936842 | 2015 |
| Oral and Maxillo Facial Surgery | 27 | 5 | 5.400000 | 2015 |
| Paediatrics | 801 | 446 | 1.795964 | 2015 |
| Public Health | 724 | 88 | 8.227273 | 2015 |
| ACCS EM | 760 | 294 | 2.585034 | 2016 |
| Anaesthetics | 1263 | 552 | 2.288044 | 2016 |
| Cardiothoracic Surgery | 61 | 6 | 10.166667 | 2016 |
| Clinical Radiology | 1074 | 212 | 5.066038 | 2016 |
| Community Sexual and Reproductive Health | 121 | 5 | 24.200000 | 2016 |
| Core Medical Training | 2516 | 1572 | 1.600509 | 2016 |
| Core Surgical Training | 1622 | 558 | 2.906810 | 2016 |
| General Practice | 4863 | 3790 | 1.283114 | 2016 |
| Histopathology | 209 | 83 | 2.518072 | 2016 |
| Neurosurgery | 169 | 25 | 6.760000 | 2016 |
| Obstetrics and Gynaecology | 551 | 181 | 3.044199 | 2016 |
| Ophthalmology | 436 | 90 | 4.844444 | 2016 |
| Oral and Maxillo Facial Surgery | 19 | 5 | 3.800000 | 2016 |
| Paediatrics | 708 | 411 | 1.722628 | 2016 |
| Public Health | 738 | 69 | 10.695652 | 2016 |
| Core Psychiatry Training | 745 | 490 | 1.520408 | 2016 |
As you can see I have already formatted the data in the long table format. So we can go straight to graphing. We will visualise the Acute Specialties.
#Filter the specialties to analyse
CompetitionRatios2 <- CompetitionRatios %>% filter(Specialty == "Anaesthetics" | Specialty == "Core Medical Training" | Specialty == "Core Surgical Training" | Specialty == "General Practice" | Specialty == "Paediatrics" | Specialty == "ACCS EM" | Specialty == "Obstetrics and Gynaecology")

ggplot(data=CompetitionRatios2, aes(x=Year, y=Ratio, group = Specialty, colour = Specialty)) +
  geom_line()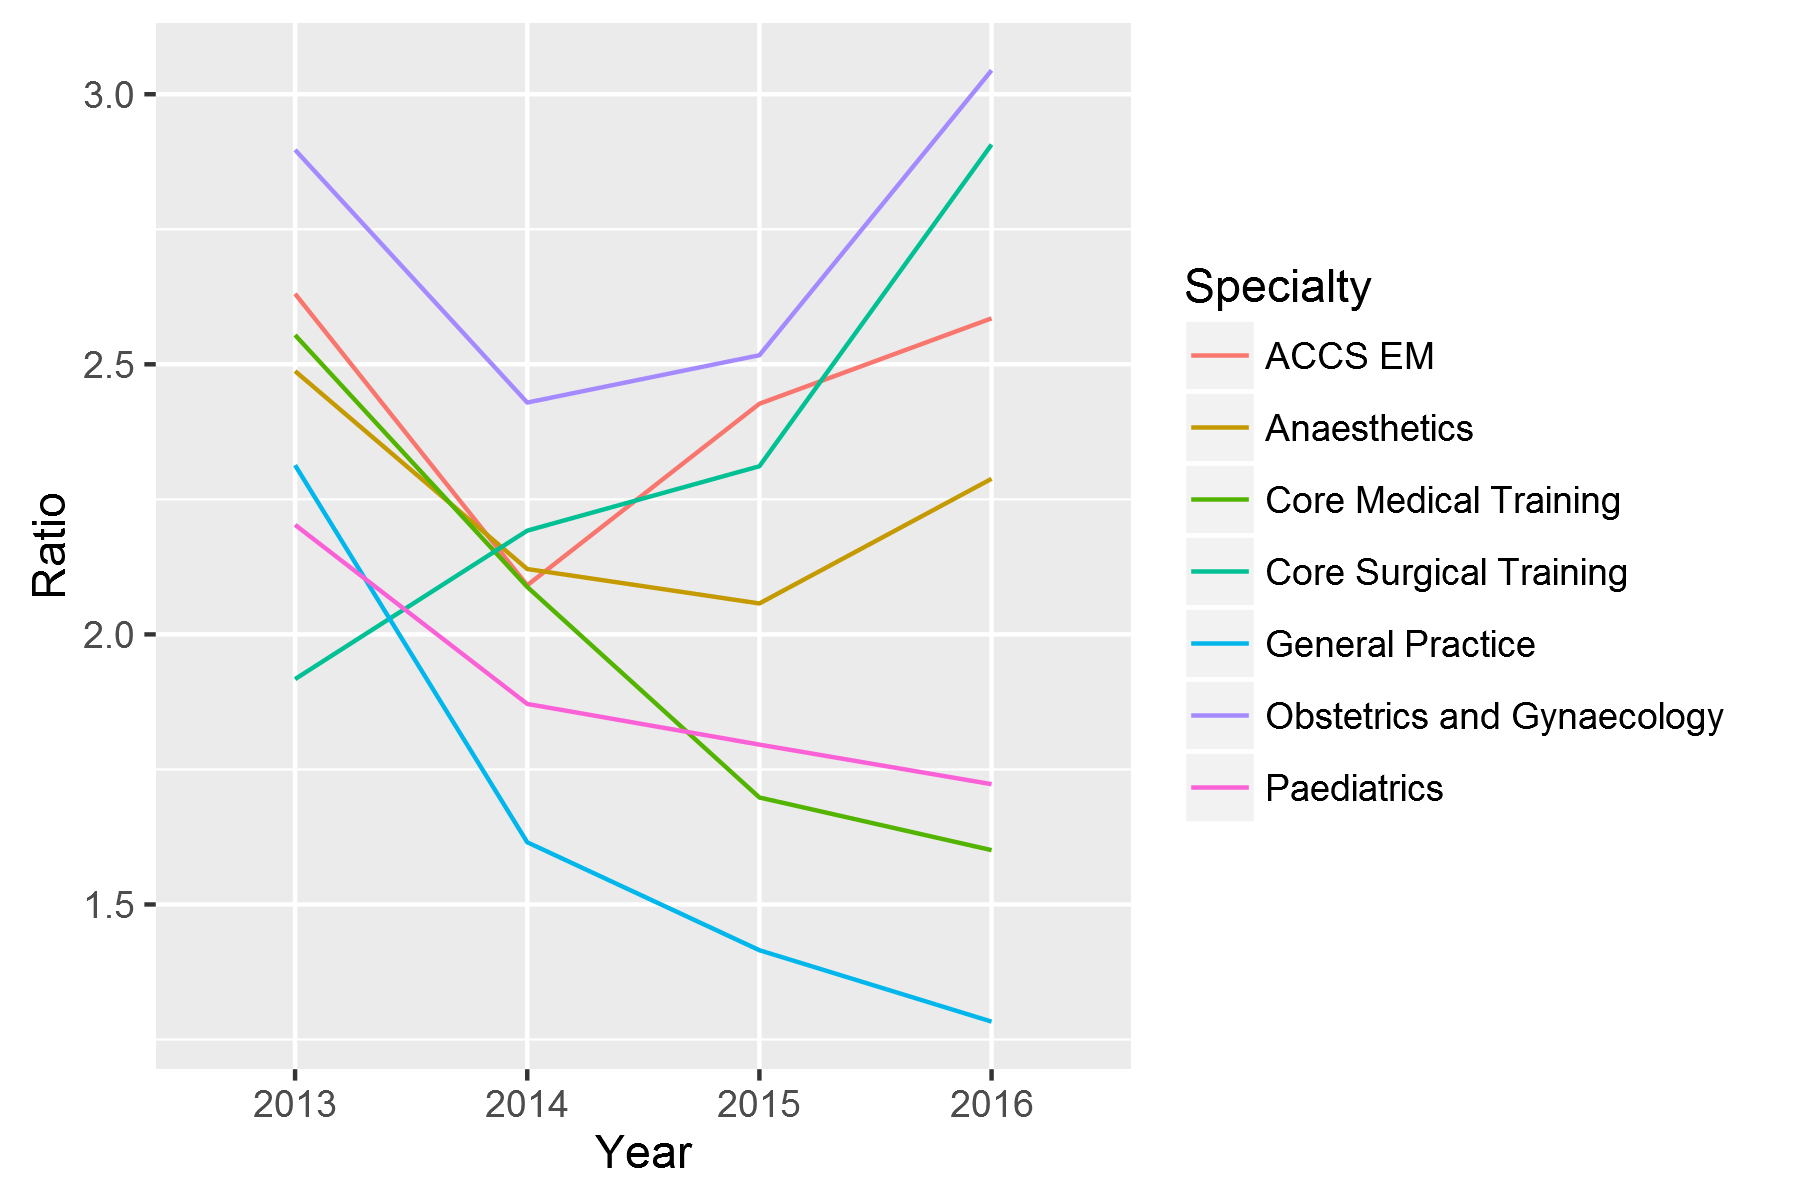
#ggsave("Ratios2013-2016.png", width = 6, height = 4, units = "in", type = "cairo-png")
ggplot(data=CompetitionRatios2, aes(x=Year, y=Applicants, group = Specialty, colour = Specialty)) +
  geom_line()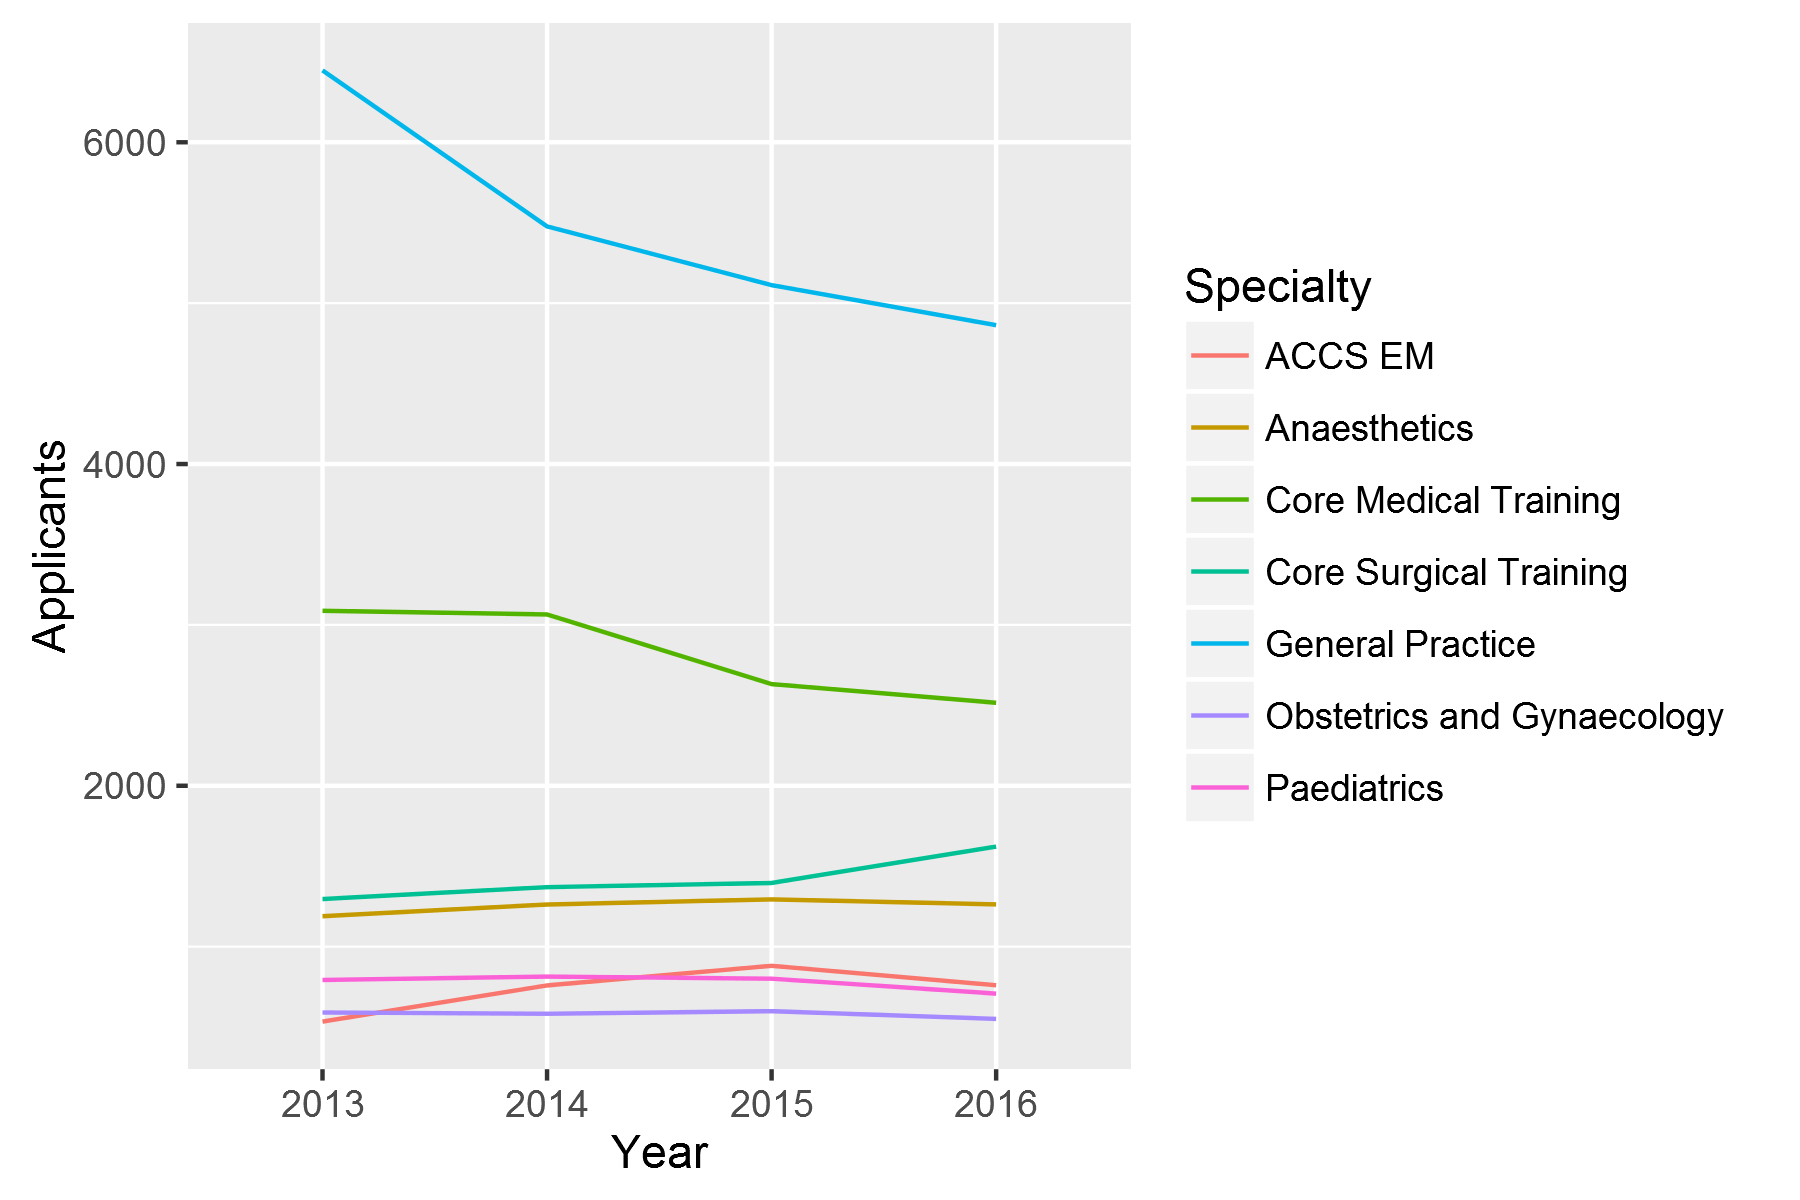
#ggsave("Applicants2013-2016.png", width = 6, height = 4, units = "in", type = "cairo-png")
ggplot(data=CompetitionRatios2, aes(x=Year, y=Posts, group = Specialty, colour = Specialty)) +
  geom_line()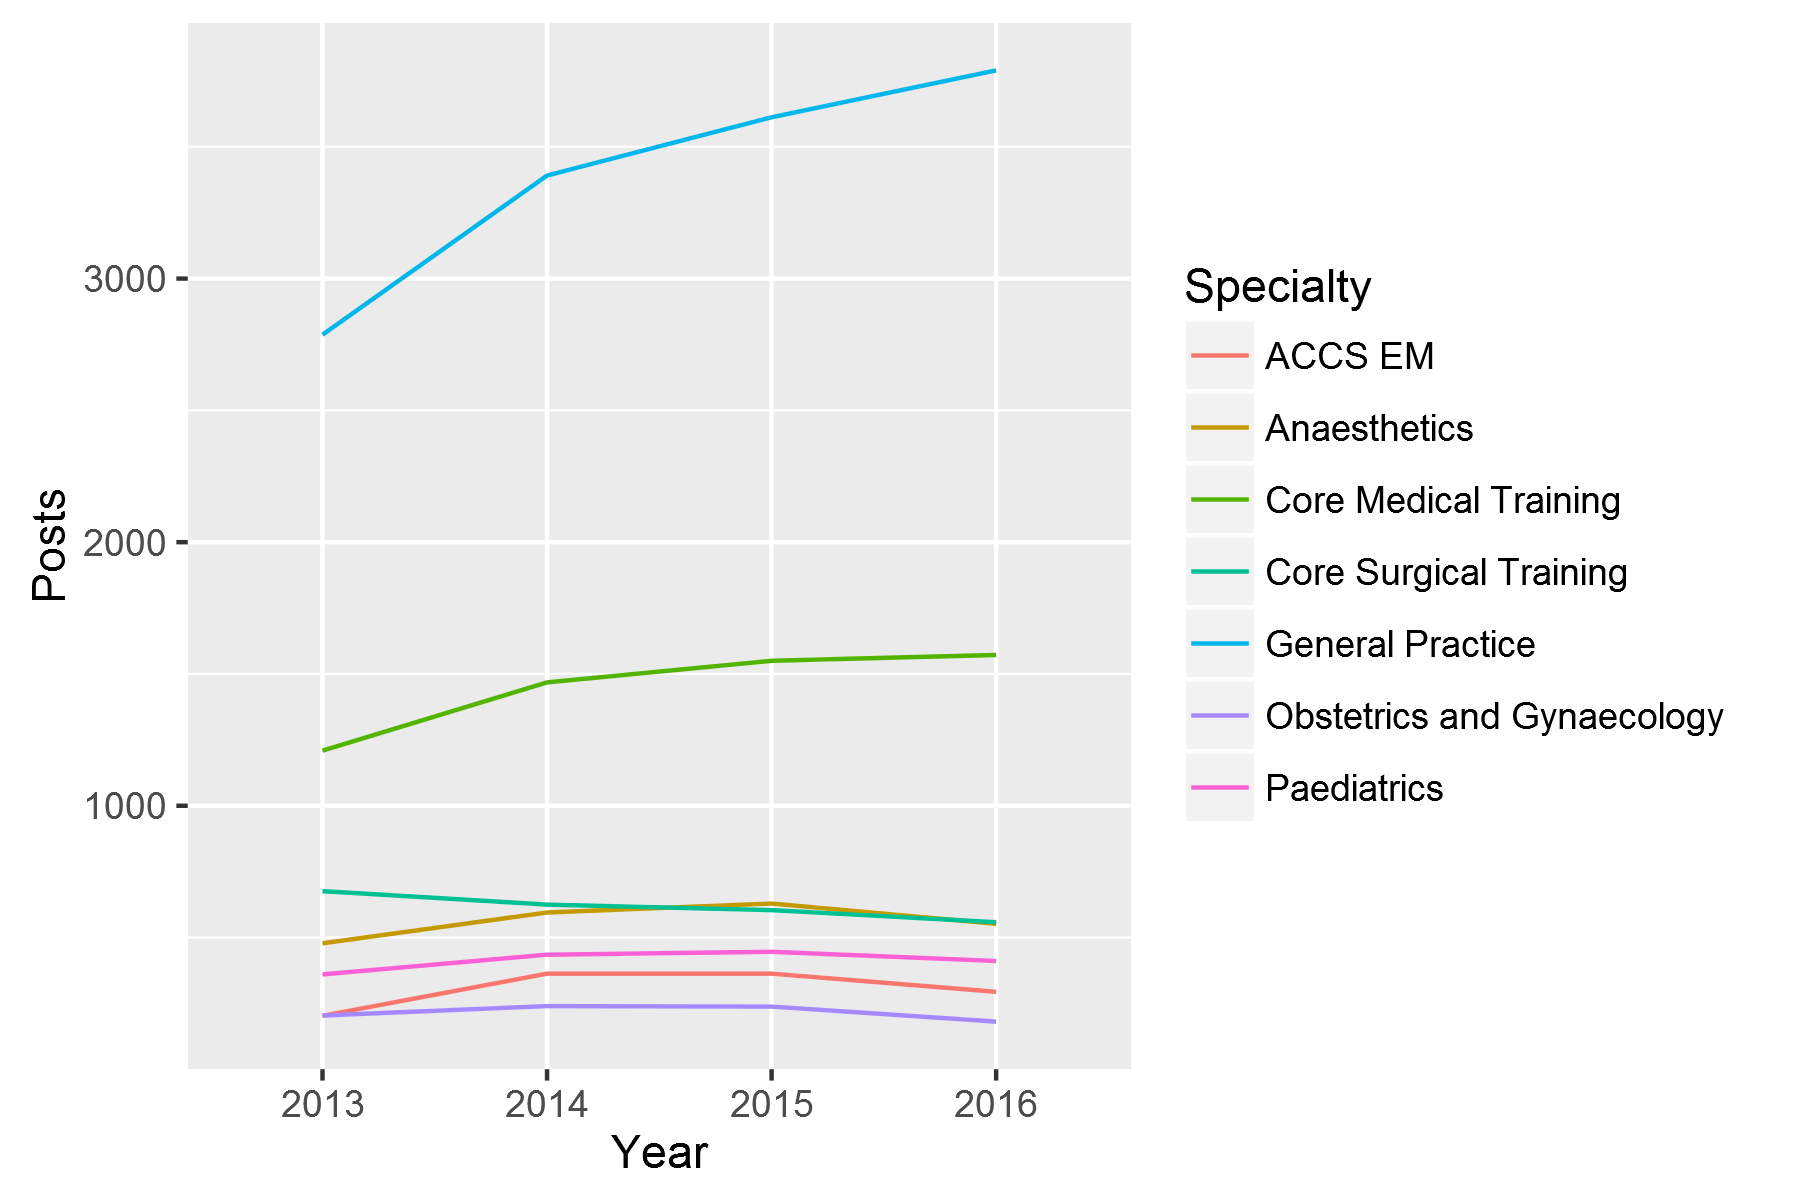
#ggsave("Posts2013-2016.png", width = 6, height = 4, units = "in", type = "cairo-png")

CompetitionRatios3 <- CompetitionRatios %>% group_by(Year) %>% summarise(TotalApplicants = sum(Applicants), TotalPosts = sum(Posts)) %>% mutate(MeanRatio = TotalApplicants/TotalPosts)

kable(CompetitionRatios3)| Year | TotalApplicants | TotalPosts | MeanRatio |
|---|---|---|---|
| 2013 | 17206 | 6916 | 2.487854 |
| 2014 | 16580 | 8192 | 2.023926 |
| 2015 | 16308 | 8545 | 1.908484 |
| 2016 | 15855 | 8343 | 1.900395 |
ggplot(data=CompetitionRatios3, aes(x=Year, y=TotalApplicants, group=0)) +
  geom_line()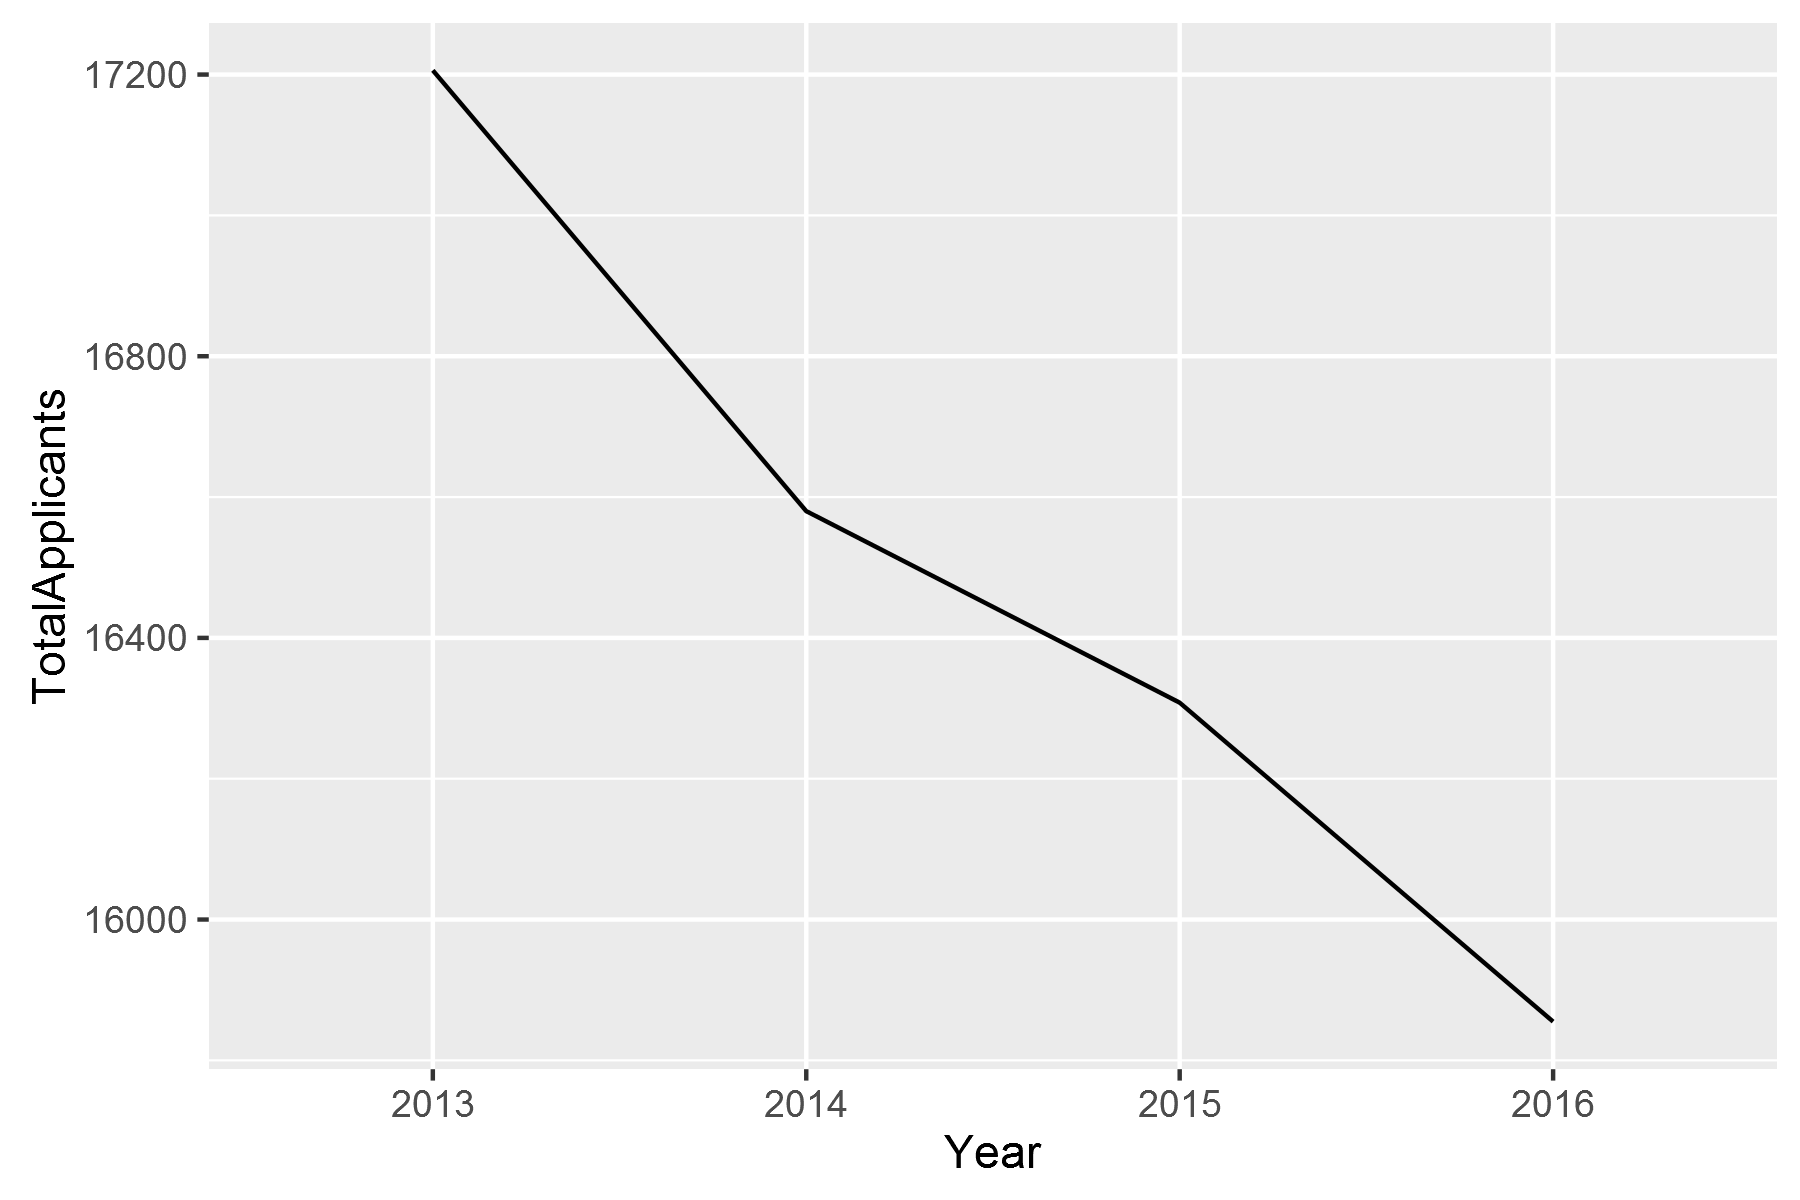
We therefore see that there’s been a 7.8519121% reduction in Total Applicants between 2013 to 2016. Also, it is particularly bad in GP (24.5695672% reduction) and CMT (18.5233161% reduction) during the same time-frame.

Danny Wong
Anaesthetist & Health Services Researcher