STROBE/CONSORT Diagrams in R
- 11 minsI have previously posted about producing manuscripts in R Markdown and highlighted my difficulty with producing STROBE/CONSORT flow diagrams programmatically in R. I ended up relying on producing the diagram in PowerPoint and then exporting the image.
I have finally been able to produce a STROBE diagram for a manuscript I’m preparing for submission, borrowing heavily from the principles described here.
This process uses the DiagrammeR package, and allows you to dynamically populate the values within each box, by altering the string values for the label vectors you set at the start.
This relies on building a grid system for your diagram, in my case I set rows to be letters a-e, and columns to be numbers 1-2, to form a 5 row x 2 column grid. To ensure that the grid is rendered correctly, even the edges that you do not want to appear need to be specified, but you set them to have render in white so they do not get drawn.
library(DiagrammeR)
library(DiagrammeRsvg) #Needed if you want to export the image
library(rsvg) #Needed if you want to export the image

#Set the values which will go into each label.
a1 <- 'Total available patients\n(n = x)'
b1 <- ''
c1 <- ''
d1 <- 'Included for analysis\n(n = x - y - z)'
e1 <- 'Data linked with\nexternal dataset'
a2 <- ''
b2 <- 'Excluded because of\nexclusion criteria (n = y)'
c2 <- 'Excluded because of\nmissing values (n = z)'
d2 <- ''
e2 <- ''

#Create a node dataframe
ndf <- create_node_df(
  n = 10,
  label = c(a1, b1, c1, d1, e1, #Column 1
            a2, b2, c2, d2, e2), #Column 2
  style = c('solid', 'invis', 'invis', 'solid', 'solid', #Column 1
            'invis', 'solid', 'solid', 'invis', 'invis'), #Column 2
  shape = c('box', 'point', 'point', 'box', 'box', #Column 1
            'plaintext', 'box', 'box', 'point', 'point'), #Column 2
  width = c(3, 0.001, 0.001, 3, 3, #Column 1
            2, 2.5, 2.5, 0.001, 0.001), #Column 2
  height = c(1, 0.001, 0.001, 1, 1, #Column 1
             1, 1, 1, 0.001, 0.001), #Column 2
  fontsize = c(rep(14, 10)),
  fontname = c(rep('Helvetica', 10)),
  penwidth = 1.5,
  fixedsize = 'true')

#Create an edge dataframe
edf <- create_edge_df(
  from = c(1, 2, 3, 4, #Column 1
           6, 7, 8, 9, #Column 2
           2, 3 #Horizontals
           ),
  to = c(2, 3, 4, 5, #Column 1
         7, 8, 9, 10, #Column 2
         7, 8 #Horizontals
         ),
  arrowhead = c('none', 'none', 'normal', 'normal', #Column 1
                'none', 'none', 'none', 'none', #Column 2
                'normal', 'normal' #Horizontals
                ),
  color = c('black', 'black', 'black', 'black', #Column 1
            '#00000000', '#00000000', '#00000000', '#00000000', #Column 2
            'black', 'black' #Horizontals
            ),
  constraint = c(rep('true', 8), #Columns
                 rep('false', 2) #Horizontals
                 )
)

g <- create_graph(ndf,
                  edf,
                  attr_theme = NULL)

#Not run: but to run this in R Studio, uncomment below
#render_graph(g)

export_graph(g, file_name = "STROBE.png")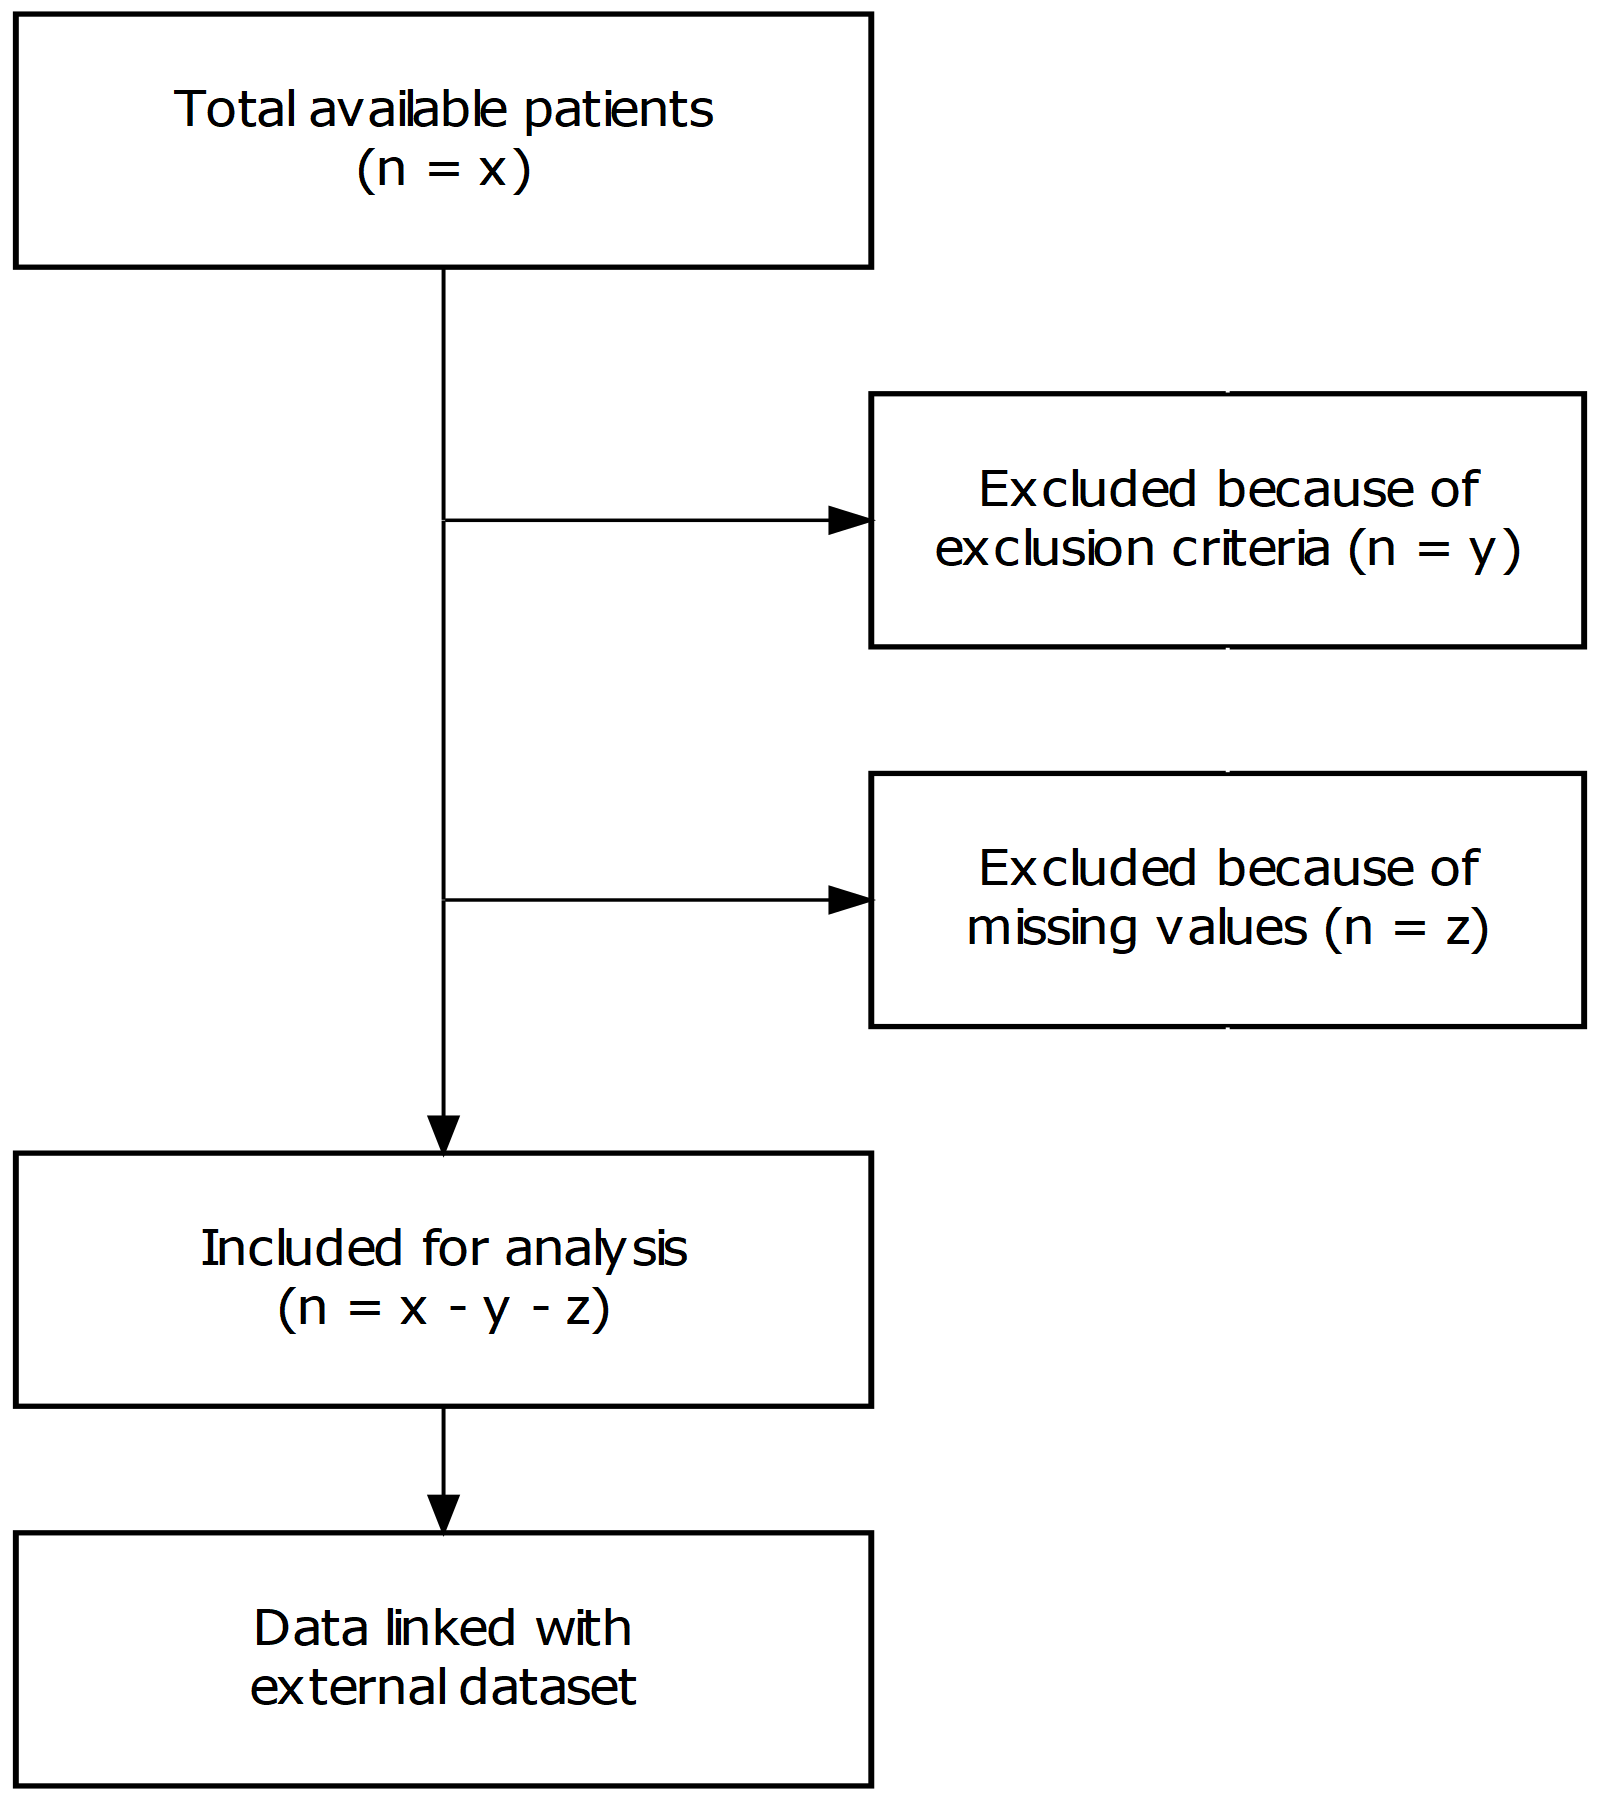
To break down how it works, let me re-draw it, this time, however we make the grid structure obvious:
#Set the values which will go into each label.
a1 <- 'a1'
b1 <- 'b1'
c1 <- 'c1'
d1 <- 'd1'
e1 <- 'e1'
a2 <- 'a2'
b2 <- 'b2'
c2 <- 'c2'
d2 <- 'd2'
e2 <- 'e2'

#Create a node dataframe
ndf <- create_node_df(
  n = 10,
  label = c(a1, b1, c1, d1, e1, #Column 1
            a2, b2, c2, d2, e2), #Column 2
  style = c('solid', 'solid', 'solid', 'solid', 'solid', #Column 1
            'solid', 'solid', 'solid', 'solid', 'solid'), #Column 2
  shape = c('box', 'box', 'box', 'box', 'box', #Column 1
            'box', 'box', 'box', 'box', 'box'), #Column 2
  width = c(1, 1, 1, 1, 1, #Column 1
            1, 1, 1, 1, 1), #Column 2
  height = c(1, 1, 1, 1, 1, #Column 1
             1, 1, 1, 1, 1), #Column 2
  fontsize = c(rep(14, 10)),
  fontname = c(rep('Helvetica', 10)),
  penwidth = 1.5,
  fixedsize = 'true')

#Create an edge dataframe
edf <- create_edge_df(
  from = c(1, 2, 3, 4, #Column 1
           6, 7, 8, 9, #Column 2
           2, 3 #Horizontals
           ),
  to = c(2, 3, 4, 5, #Column 1
         7, 8, 9, 10, #Column 2
         7, 8 #Horizontals
         ),
  arrowhead = c('none', 'none', 'normal', 'normal', #Column 1
                'none', 'none', 'none', 'none', #Column 2
                'normal', 'normal' #Horizontals
                ),
  color = c('black', 'black', 'black', 'black', #Column 1
            '#00000000', '#00000000', '#00000000', '#00000000', #Column 2
            'black', 'black' #Horizontals
            ),
  constraint = c(rep('true', 8), #Columns
                 rep('false', 2) #Horizontals
                 )
)

g <- create_graph(ndf,
                  edf,
                  attr_theme = NULL)

export_graph(g, file_name = "grid.png")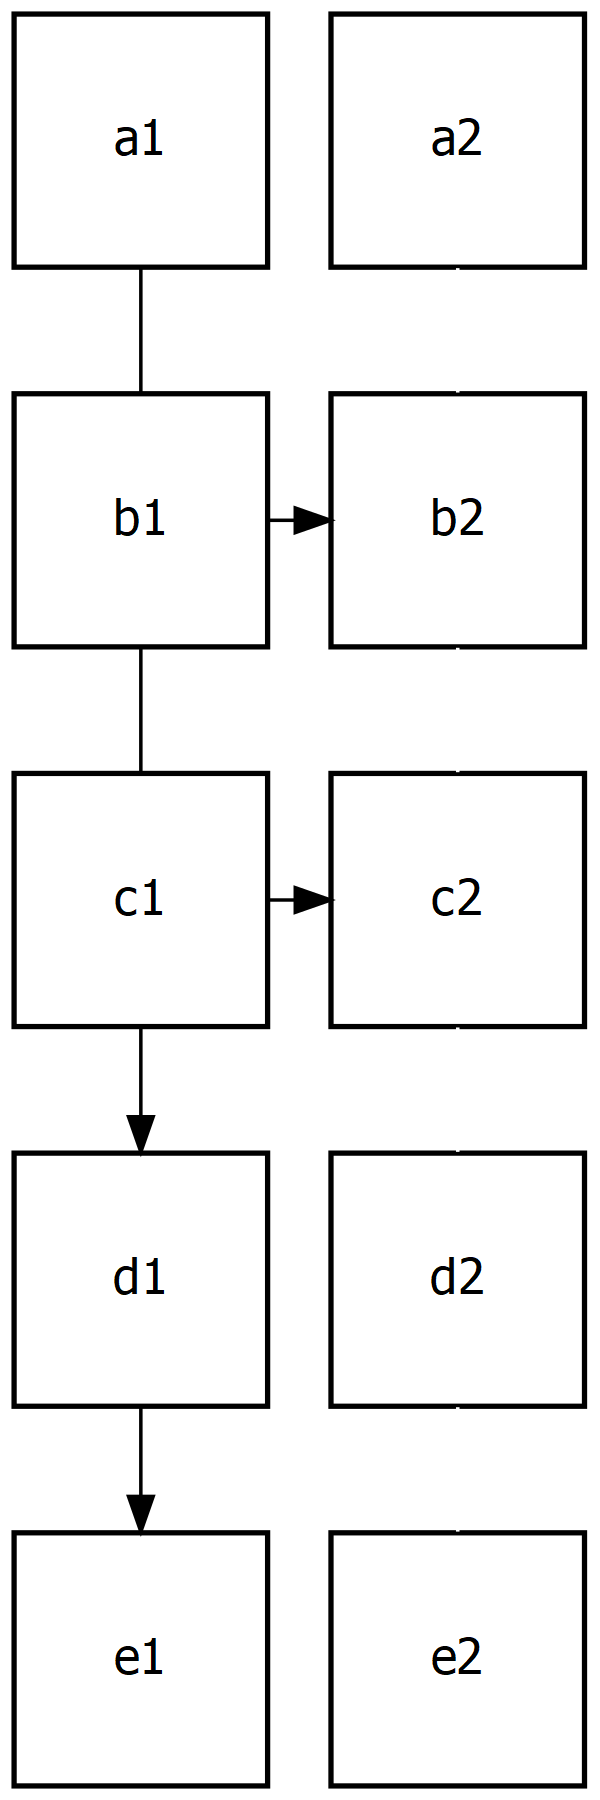
sessionInfo()## R version 3.4.2 (2017-09-28)
## Platform: x86_64-w64-mingw32/x64 (64-bit)
## Running under: Windows >= 8 x64 (build 9200)
##
## Matrix products: default
##
## locale:
## [1] LC_COLLATE=English_United Kingdom.1252
## [2] LC_CTYPE=English_United Kingdom.1252
## [3] LC_MONETARY=English_United Kingdom.1252
## [4] LC_NUMERIC=C
## [5] LC_TIME=English_United Kingdom.1252
##
## attached base packages:
## [1] stats graphics grDevices utils datasets methods base
##
## other attached packages:
## [1] knitr_1.17 bindrcpp_0.2 rsvg_1.1 DiagrammeRsvg_0.1
## [5] DiagrammeR_0.9.2
##
## loaded via a namespace (and not attached):
## [1] Rcpp_0.12.14 highr_0.6 compiler_3.4.2
## [4] RColorBrewer_1.1-2 influenceR_0.1.0 plyr_1.8.4
## [7] bindr_0.1 viridis_0.4.1 tools_3.4.2
## [10] digest_0.6.14 evaluate_0.10.1 jsonlite_1.5
## [13] viridisLite_0.2.0 tibble_1.3.4 gtable_0.2.0
## [16] rgexf_0.15.3 pkgconfig_2.0.1 rlang_0.1.4
## [19] igraph_1.1.2 rstudioapi_0.7 curl_1.2
## [22] yaml_2.1.14 gridExtra_2.3 downloader_0.4
## [25] dplyr_0.7.4 stringr_1.2.0 htmlwidgets_1.0
## [28] hms_0.3 grid_3.4.2 glue_1.1.1
## [31] R6_2.1.2 Rook_1.1-1 XML_3.98-1.4
## [34] readr_1.1.1 purrr_0.2.4 tidyr_0.7.2
## [37] ggplot2_2.2.1 magrittr_1.5 scales_0.5.0
## [40] htmltools_0.3.6 assertthat_0.1 colorspace_1.2-6
## [43] brew_1.0-6 V8_1.5 stringi_1.1.1
## [46] visNetwork_2.0.3 lazyeval_0.2.0 munsell_0.4.3
Danny Wong
Anaesthetist & Health Services Researcher